OPEN-SOURCE SCRIPT
מעודכן Leverage Liquidation Circles/dots/alerts
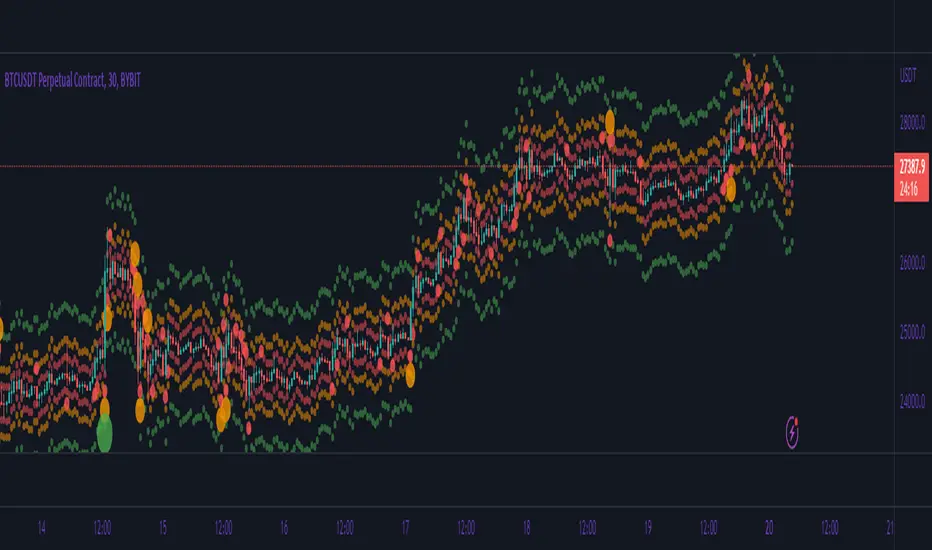
This plots liquidation alerts for different levels of leverage. The script calculates the liquidation prices for both long and short positions based on the inputted leverage values. Then, it plots dots on the chart where liquidation can occur for each level of leverage. Additionally, it plots circles on the chart only when a liquidation event occurs, at which point the circle changes color to indicate the level of leverage that triggered the liquidation.
The script allows traders to visualize potential liquidation events for different levels of leverage, which can be helpful in managing risk when trading on margin. The different colors of the circles can quickly communicate which level of leverage triggered the liquidation, allowing traders to quickly assess the situation and adjust their positions if necessary.
The script allows traders to visualize potential liquidation events for different levels of leverage, which can be helpful in managing risk when trading on margin. The different colors of the circles can quickly communicate which level of leverage triggered the liquidation, allowing traders to quickly assess the situation and adjust their positions if necessary.
הערות שחרור
added highlight on high concentration of dots. still work in progressהערות שחרור
added past liquidation levels. they act as magnets for liquidity + updating to pine v5הערות שחרור
removed some features not meant to be added. added feature that makes dots not visible on the timeframes bigger than 1 hour
הערות שחרור
added more lev circlesadded highlights before vol
סקריפט קוד פתוח
ברוח האמיתית של TradingView, יוצר הסקריפט הזה הפך אותו לקוד פתוח, כך שסוחרים יוכלו לעיין בו ולאמת את פעולתו. כל הכבוד למחבר! אמנם ניתן להשתמש בו בחינם, אך זכור כי פרסום חוזר של הקוד כפוף ל־כללי הבית שלנו.
~matt
כתב ויתור
המידע והפרסומים אינם מיועדים להיות, ואינם מהווים, ייעוץ או המלצה פיננסית, השקעתית, מסחרית או מכל סוג אחר המסופקת או מאושרת על ידי TradingView. קרא עוד ב־תנאי השימוש.