UDAY_C_Santhakumar

DMI Stochastic Extereme

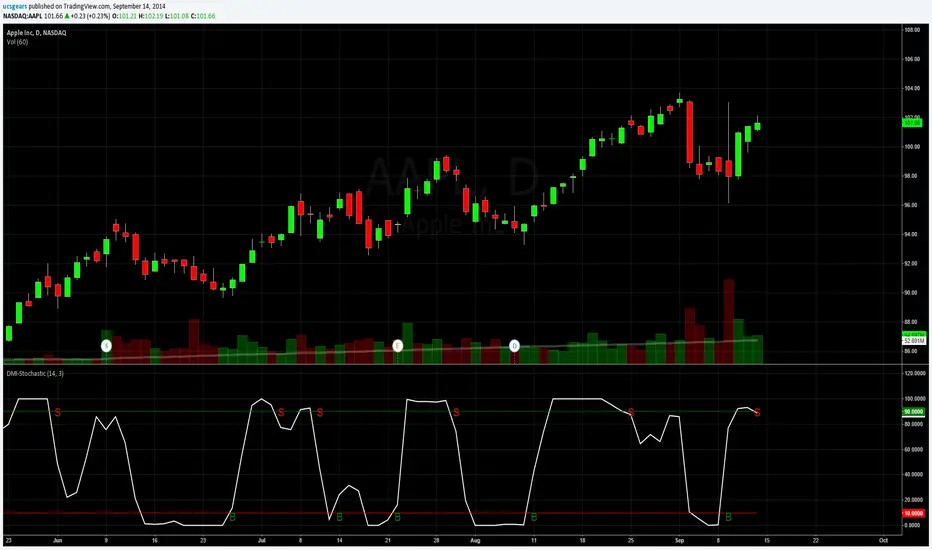
USed the DMI Oscillator created by LARK " " to create this DMI Stochastic Extreme. You can also use the DMI Stochastic by Lark
Updated Version -

Uday C Santhakumar
סקריפט קוד פתוח

ברוח TradingView אמיתית, מחבר הסקריפט הזה פרסם אותו בקוד פתוח, כך שסוחרים יכולים להבין ולאמת אותו. כל הכבוד למחבר! אתה יכול להשתמש בו בחינם, אך שימוש חוזר בקוד זה בפרסום כפוף לכללי הבית. אתה יכול להכניס אותו למועדפים כדי להשתמש בו בגרף.

כתב ויתור

המידע והפרסומים אינם אמורים להיות, ואינם מהווים, עצות פיננסיות, השקעות, מסחר או סוגים אחרים של עצות או המלצות שסופקו או מאושרים על ידי TradingView. קרא עוד בתנאים וההגבלות.

רוצה להשתמש בסקריפ זה בגרף?
study(title="DMI Stochastic Extreme", shorttitle="DMI-Stochastic", overlay=false)
// Wells Wilders MA
wwma(l,p) =>
    wwma = (nz(wwma[1]) * (l - 1) + p) / l

// Inputs
DMIlength = input(10)
Stolength = input(3)

// DMI Osc Calc
hiDiff = high - high[1]
loDiff = low[1] - low
plusDM = (hiDiff > loDiff) and (hiDiff > 0) ? hiDiff : 0
minusDM = (loDiff > hiDiff) and (loDiff > 0) ? loDiff : 0
ATR = wwma(DMIlength, tr)
PlusDI = 100 * wwma(DMIlength,plusDM) / ATR
MinusDI = 100 * wwma(DMIlength,minusDM) / ATR
osc = PlusDI - MinusDI

// DMI Stochastic Calc
hi = highest(osc, Stolength)
lo = lowest(osc, Stolength)

Stoch = sum((osc-lo),Stolength) / sum((hi-lo),Stolength) *100
plot(Stoch, color = white, title = 'Stochastic', linewidth = 2, style = line)

p0 = 0
p1 = 100
p2 = 90
p3 = 10

crossUp = Stoch[1] < 10 and Stoch >10 ? 1 : 0
crossDown = Stoch[1] > 90 and Stoch < 90 ? 1 : 0

//crossP3 = cross(Stoch,p3)

//circleYPosition = crossP3
//circleYPosition = p3
//circleYPosition_l = p2

plot (p3, color = red, linewidth = 1, title = 'Over Bought')
plot (p2, color = green, linewidth = 1, title = 'Over Sold')

//plot(crossUp and crossP3 ? circleYPosition : na, color = green, style = cross, linewidth = 4, title='Long')
//plot(crossUp ? circleYPosition : na, color = green, style = cross, linewidth = 4, title='Long', offset=-1)
//plot(sd and cross_down and cross(sma(ac, 1), achm) ? circleYPosition : na,style=cross, linewidth=6, color=fuchsia)
//plot(crossDown ? circleYPosition_l : na,style=cross, linewidth=6, color=fuchsia, offset=-1)

//plot(cross(Stoch,p2) ? Stoch : na, color = Stoch < p2 ? red : na, style = cross, linewidth = 4, title='Short')

plotchar(crossUp, title="i", char='B', location=location.bottom, color=green, transp=0, offset=0)
plotchar(crossDown, title="Gann Swing Low Plots-Triangles Up Bottom of Screen",char='S', offset=0, location=location.top, color=red, transp=0)