CM EMA Crossover Price Probabilities custom
This indicator combines Exponential Moving Average (EMA) crossovers with swing high/low detection to calculate and display the historical probability of price movements exceeding user-defined percentage thresholds. Unlike standard EMA crossover indicators, it quantifies the likelihood of specific price changes following bullish (fast EMA crossing above slow EMA) or bearish (fast EMA crossing below slow EMA) crossovers, providing traders with data-driven insights into potential price behavior.
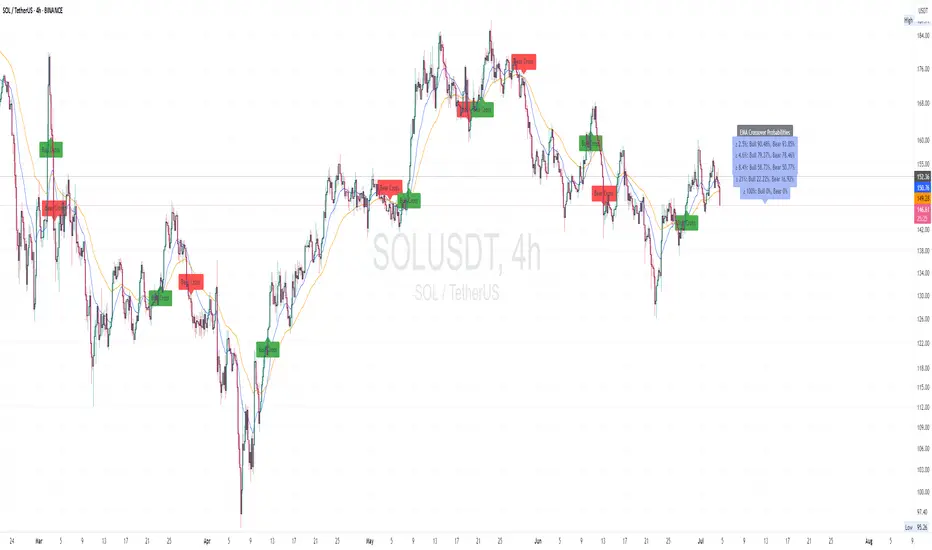
How It Works:EMA Crossovers: Detects when the fast EMA crosses above (bullish) or below (bearish) the slow EMA, marking these events with chart labels.
Price Change Measurement: Measures the percentage price change from the crossover point to the next swing high (for bullish crossovers) or swing low (for bearish crossovers), using pivot point detection.
Probability Calculation: Analyses historical crossover data to compute the probability of price changes meeting or exceeding customizable percentage thresholds (e.g., 2.5%, 5%). Probabilities are displayed as labels on the last bar, showing both bullish and bearish outcomes.
Customization: Allows users to adjust EMA lengths, pivot lookback, historical data limit, and probability thresholds via inputs.
Inputs:Fast EMA Length (default: 20): Period for the fast EMA.
Slow EMA Length (default: 50): Period for the slow EMA.
Pivot Lookback (default: 15): Bars used to detect swing highs/lows.
Max Historical Crossovers (default: 100): Limits stored crossovers for performance.
Bin Thresholds (defaults: 2.5%, 4.6%, 8.4%, 21.0%, 100.0%): Five customizable percentage thresholds for probability calculations.
Usage:
Add the indicator to your chart and adjust inputs to match your trading style. Bullish and bearish crossover points are labeled on the chart, and probability labels appear in the top-right corner when sufficient data is available. Use these probabilities to assess the historical likelihood of price movements after EMA crossovers, aiding in trade planning or risk assessment.
Why It’s Useful:
By combining EMA crossovers with swing-based price change analysis, this indicator offers a unique perspective on market behaviour post-crossover. The customizable probability thresholds allow traders to focus on specific price movement targets, making it a versatile tool for studying trend strength and potential outcomes.
Notes:
Probabilities are based on historical data and do not predict future performance.
Set bin thresholds in ascending order for accurate probability calculations.
Designed for educational purposes to analyze EMA crossover patterns.
סקריפט להזמנה בלבד
רק משתמשים שאושרו על ידי המחבר יכולים לגשת לסקריפט הזה. יהיה עליך לשלוח בקשת גישה ולקבל אישור לשימוש. בדרך כלל, הגישה ניתנת לאחר תשלום. למידע נוסף, עקוב אחר ההוראות של היוצר בהמשך או צור קשר עם CryptoMainly ישירות.
TradingView לא ממליצה לשלם עבור סקריפט או להשתמש בו אלא אם כן אתה סומך לחלוטין על המחבר שלו ומבין כיצד הוא פועל. ייתכן שתוכל גם למצוא חלופות חינמיות וקוד פתוח ב-סקריפטים הקהילתיים שלנו.
הוראות המחבר
כתב ויתור
סקריפט להזמנה בלבד
רק משתמשים שאושרו על ידי המחבר יכולים לגשת לסקריפט הזה. יהיה עליך לשלוח בקשת גישה ולקבל אישור לשימוש. בדרך כלל, הגישה ניתנת לאחר תשלום. למידע נוסף, עקוב אחר ההוראות של היוצר בהמשך או צור קשר עם CryptoMainly ישירות.
TradingView לא ממליצה לשלם עבור סקריפט או להשתמש בו אלא אם כן אתה סומך לחלוטין על המחבר שלו ומבין כיצד הוא פועל. ייתכן שתוכל גם למצוא חלופות חינמיות וקוד פתוח ב-סקריפטים הקהילתיים שלנו.