OPEN-SOURCE SCRIPT
[_ParkF]Mini Chart(BB)
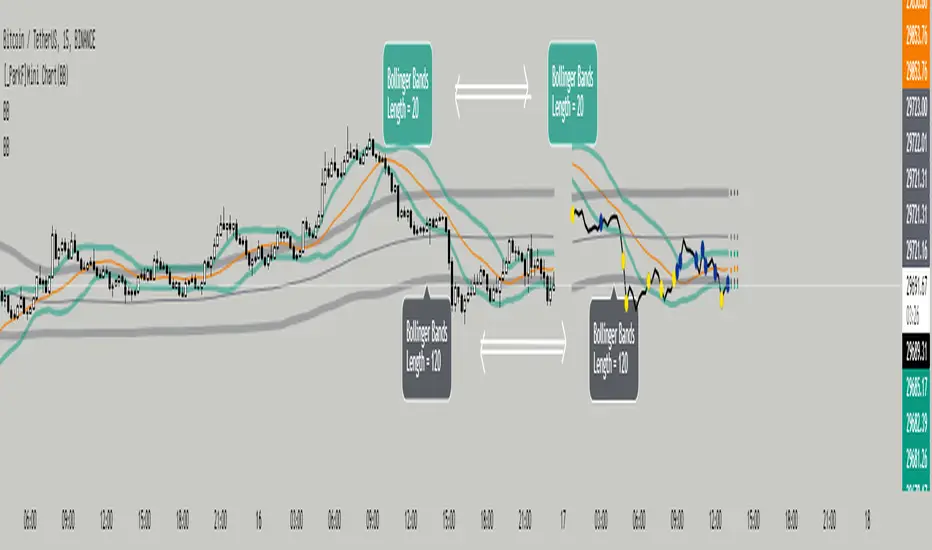
Bollinger Bands of different lengths are displayed with a line chart in front of the candle.
A Bollinger band with a length of 20 and a Bollinger band with a length of 120 can be easily identified by the circle and color displayed whenever the line passes.
In the input menu, you can edit the length and deviation of the Bollinger band, the number of candles to be displayed in front, the thickness of the line, the color, and the color of the circle.
And the expected value of each Bollinger band was measured and displayed.
You can change the thickness and color of the displayed predictive circle in Predictive of the input menu.
-------------------------------------------------------------------------------------------------------------------------------------------------------------------------------------------------------------------------------------------
서로 다른 기간값을 가진 볼린저밴드를 캔들보다 앞쪽에 선 차트와 함께 표시하였습니다.
20의 기간값을 가진 볼린저밴드와 120의 기간값을 가진 볼린저밴드를 선차트가 크로스할 때 마다 표시되는 점과 색을 통해 쉽게 식별할 수 있습니다.
input 메뉴에서 볼린저밴드의 기간값과 편차, 앞 쪽에 표시될 캔들의 수와 선의 두께, 색상, 점의 색상을 수정할 수 있습니다.
그리고 각 볼린저밴드의 예상 값을 측정하여 표시하였습니다.
input 메뉴의 Predictive에서 표시된 Predictive circle의 두께와 색상을 변경할 수 있습니다.
סקריפט קוד פתוח
ברוח האמיתית של TradingView, יוצר הסקריפט הזה הפך אותו לקוד פתוח, כך שסוחרים יוכלו לעיין בו ולאמת את פעולתו. כל הכבוד למחבר! אמנם ניתן להשתמש בו בחינם, אך זכור כי פרסום חוזר של הקוד כפוף ל־כללי הבית שלנו.
כתב ויתור
המידע והפרסומים אינם מיועדים להיות, ואינם מהווים, ייעוץ או המלצה פיננסית, השקעתית, מסחרית או מכל סוג אחר המסופקת או מאושרת על ידי TradingView. קרא עוד ב־תנאי השימוש.