PROTECTED SOURCE SCRIPT
First X Hours – Daily & Weekly (Auto-DST, Midlines & Labels)
Description
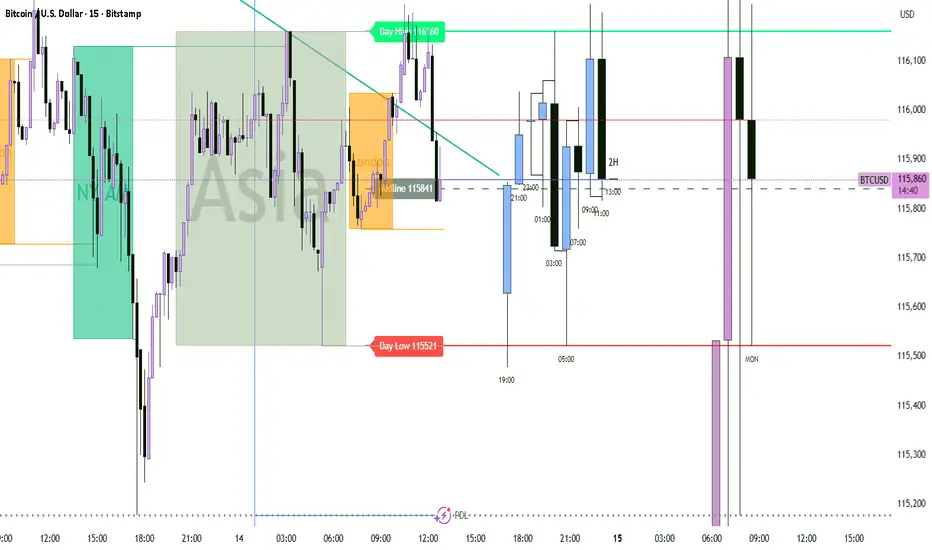
This indicator automatically plots the High, Low, and optional Midline of the first X trading hours for both the Daily and Weekly sessions. It is designed for traders who want to quickly identify early-session ranges and key levels that often act as intraday or intraweek support/resistance zones.
✅ Features:
Works for both Daily and Weekly sessions (enable/disable individually).
Fully configurable: choose how many hours to include (e.g., 8 hours).
Adjustable start time (hour) and automatic DST handling using named timezones (e.g., Europe/London, New York, Sydney).
Customizable line colours, thickness, and styles.
Optional midline (average of high & low) for range balance levels.
Optional labels with price tags for clear visibility.
Lines can be extended to the right for forward-projection.
🔎 Use cases:
Identify early-session ranges that may define the trading day or week.
Track breakouts above/below first-X-hours ranges.
Highlight key liquidity levels where price often reacts.
Combine with your strategy for confirmation of reversals or continuations.
⚠️ Note:
Indicator does not provide trading signals.
Best used on intraday timeframes (e.g., 5m–1h) for daily ranges, and H1–H4 for weekly ranges.
סקריפט מוגן
סקריפט זה פורסם כמקור סגור. עם זאת, אתה יכול להשתמש בו באופן חופשי וללא כל הגבלה - למד עוד כאן.
כתב ויתור
המידע והפרסומים אינם אמורים להיות, ואינם מהווים, עצות פיננסיות, השקעות, מסחר או סוגים אחרים של עצות או המלצות שסופקו או מאושרים על ידי TradingView. קרא עוד בתנאים וההגבלות.
סקריפט מוגן
סקריפט זה פורסם כמקור סגור. עם זאת, אתה יכול להשתמש בו באופן חופשי וללא כל הגבלה - למד עוד כאן.
כתב ויתור
המידע והפרסומים אינם אמורים להיות, ואינם מהווים, עצות פיננסיות, השקעות, מסחר או סוגים אחרים של עצות או המלצות שסופקו או מאושרים על ידי TradingView. קרא עוד בתנאים וההגבלות.