PROTECTED SOURCE SCRIPT
מעודכן Percent up to ATH v. 2.0 (CHECK 1D TIMEFRAME)
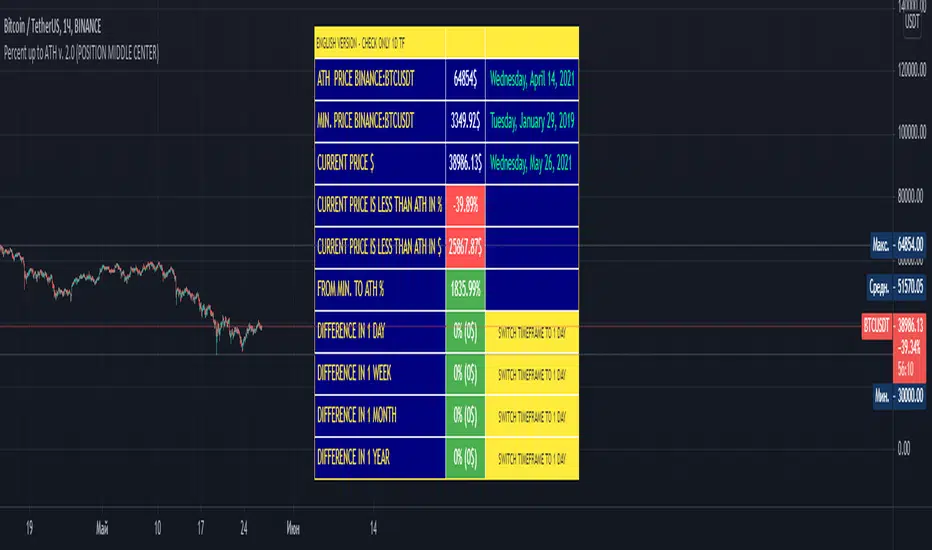
for the label to display the price change for 1 day, 1 week, 1 month and 1 year, you must switch the graph to the daily (1D) timeframe
this script shows:
- the maximum price and the date of this maximum
- the minimum price and date of this minimum
- current price and date of this price
- the difference between the current price and the maximum price in percent (%) and in dollars ($)
- the difference between the minimum price and the maximum price in percent (%) and in dollars ($)
- price change in percent and dollars for 1 day, 1 week, 1 month and 1 year
this script displays information in two languages - English and Russian

---------------------------------------------------------------------------------------------------------------------------------------------------------------------------------------------------------------
Чтобы на метке отображалось изменение цены за 1 день, 1 неделю, 1 месяц и 1 год, необходимо переключить график на дневной (1D) таймфрейм
этот скрипт показывает:
- максимальную цена и дату этого максимума
- минимальную цена и дату этого минимума
- текущую цена и дату этой цены
- разница между текущей ценой и максимальной ценой в процентах (%) и в долларах ($)
- разница между минимальной ценой и максимальной ценой в процентах (%) и в долларах ($)
- изменение цены в процентах и долларах за 1 день, 1 неделю, 1 месяц и 1 год
этот скрипт отображает информацию на двух языках - английском и русском.

this script shows:
- the maximum price and the date of this maximum
- the minimum price and date of this minimum
- current price and date of this price
- the difference between the current price and the maximum price in percent (%) and in dollars ($)
- the difference between the minimum price and the maximum price in percent (%) and in dollars ($)
- price change in percent and dollars for 1 day, 1 week, 1 month and 1 year
this script displays information in two languages - English and Russian
---------------------------------------------------------------------------------------------------------------------------------------------------------------------------------------------------------------
Чтобы на метке отображалось изменение цены за 1 день, 1 неделю, 1 месяц и 1 год, необходимо переключить график на дневной (1D) таймфрейм
этот скрипт показывает:
- максимальную цена и дату этого максимума
- минимальную цена и дату этого минимума
- текущую цена и дату этой цены
- разница между текущей ценой и максимальной ценой в процентах (%) и в долларах ($)
- разница между минимальной ценой и максимальной ценой в процентах (%) и в долларах ($)
- изменение цены в процентах и долларах за 1 день, 1 неделю, 1 месяц и 1 год
этот скрипт отображает информацию на двух языках - английском и русском.
הערות שחרור
[ENG]In this version I added a position selection for the label. As well as notification about if the daily timeframe is not enabled
-------------------------------------------------------------------------
[RUS]
В этой версии я добавил выбор позиции для метки. А так же оповещание о том , если не включен дневной таймфрейм
סקריפט מוגן
סקריפט זה פורסם כמקור סגור. עם זאת, תוכל להשתמש בו בחופשיות וללא כל מגבלות – למד עוד כאן
כתב ויתור
המידע והפרסומים אינם מיועדים להיות, ואינם מהווים, ייעוץ או המלצה פיננסית, השקעתית, מסחרית או מכל סוג אחר המסופקת או מאושרת על ידי TradingView. קרא עוד ב־תנאי השימוש.
סקריפט מוגן
סקריפט זה פורסם כמקור סגור. עם זאת, תוכל להשתמש בו בחופשיות וללא כל מגבלות – למד עוד כאן
כתב ויתור
המידע והפרסומים אינם מיועדים להיות, ואינם מהווים, ייעוץ או המלצה פיננסית, השקעתית, מסחרית או מכל סוג אחר המסופקת או מאושרת על ידי TradingView. קרא עוד ב־תנאי השימוש.