OPEN-SOURCE SCRIPT
Multi Perdiod Smoothed Money Flow Index

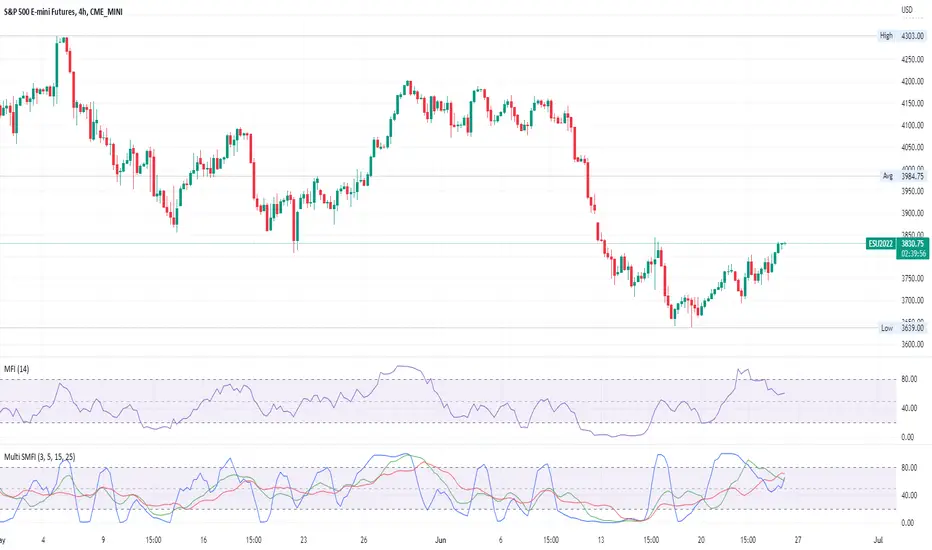
Using the Built in function of the Money Flow Index, except it plots three different smoothed lengths of the MFI.
(The Money Flow Index (MFI) is a technical indicator that generates overbought or oversold signals using both prices and volume data.)
This indicator plots three smoothed lines of the Money Flow Index, each with different period length. The idea here is that having multiple signals given from analysing different period lengths should minimise the amount of false signals taken by the MFI.
Idea taken from the existence of the same styled indicator for Stochastics.
סקריפט קוד פתוח
ברוח האמיתית של TradingView, יוצר הסקריפט הזה הפך אותו לקוד פתוח, כך שסוחרים יוכלו לעיין בו ולאמת את פעולתו. כל הכבוד למחבר! אמנם ניתן להשתמש בו בחינם, אך זכור כי פרסום חוזר של הקוד כפוף ל־כללי הבית שלנו.
כתב ויתור
המידע והפרסומים אינם מיועדים להיות, ואינם מהווים, ייעוץ או המלצה פיננסית, השקעתית, מסחרית או מכל סוג אחר המסופקת או מאושרת על ידי TradingView. קרא עוד ב־תנאי השימוש.