OPEN-SOURCE SCRIPT
VIX:VIX3M Ratio
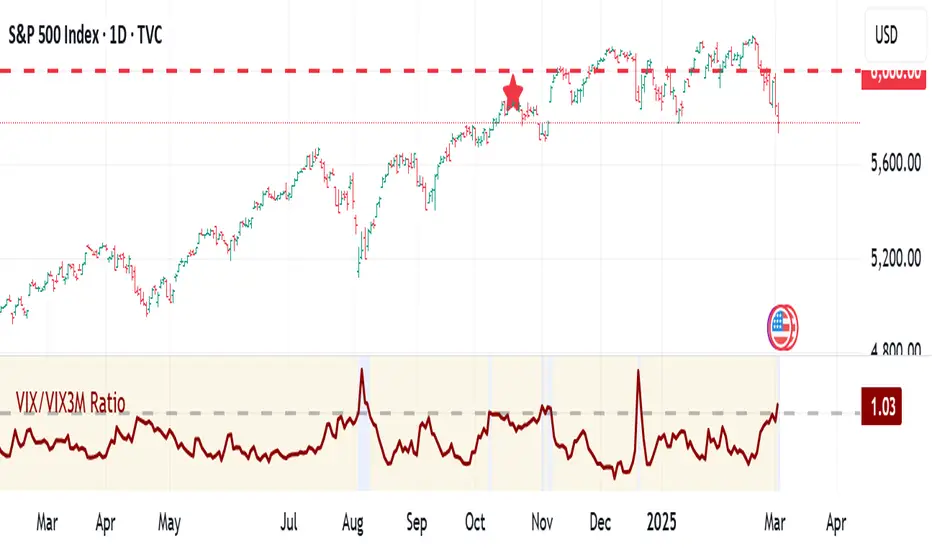
The VIX/VIX3M Ratio indicator compares the short-term (1-month) volatility index (VIX) to the medium-term (3-month) volatility index (VIX3M). This ratio provides insights into the market's volatility expectations across different time horizons.
Key Interpretations:
Potential Trading Insights:
Key Interpretations:
- Ratio > 1: Short-term volatility expectations are higher than 3-month expectations
- Ratio = 1: Short-term and medium-term volatility expectations are aligned
- Ratio < 1: Medium-term volatility expectations are higher than short-term expectations
Potential Trading Insights:
- A rising ratio may indicate increasing near-term market uncertainty
- Significant deviations from 1.0 can signal potential market stress or changing risk perceptions
- Traders use this to gauge the term structure of market volatility
סקריפט קוד פתוח
ברוח האמיתית של TradingView, יוצר הסקריפט הזה הפך אותו לקוד פתוח, כך שסוחרים יוכלו לעיין בו ולאמת את פעולתו. כל הכבוד למחבר! אמנם ניתן להשתמש בו בחינם, אך זכור כי פרסום חוזר של הקוד כפוף ל־כללי הבית שלנו.
כתב ויתור
המידע והפרסומים אינם מיועדים להיות, ואינם מהווים, ייעוץ או המלצה פיננסית, השקעתית, מסחרית או מכל סוג אחר המסופקת או מאושרת על ידי TradingView. קרא עוד ב־תנאי השימוש.