OPEN-SOURCE SCRIPT
מעודכן TFEX_INDICATOR_SET13

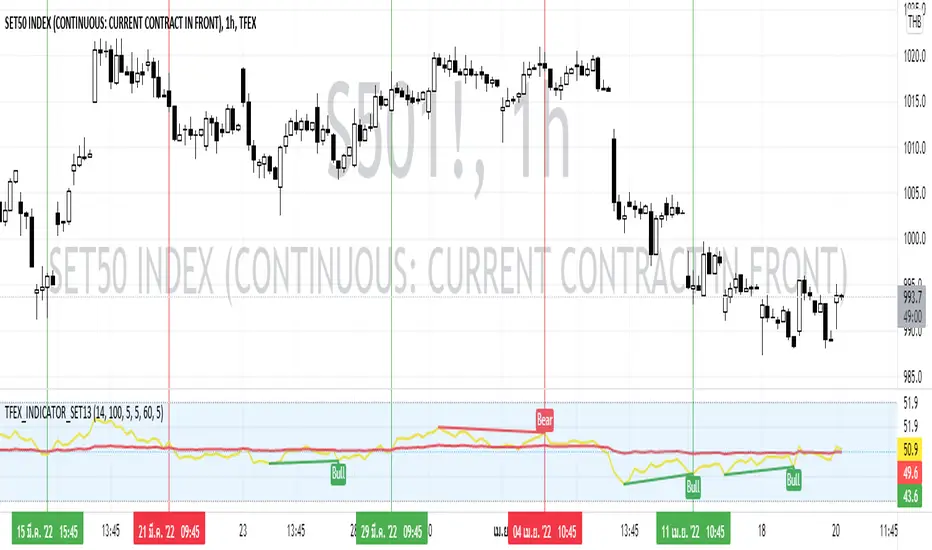
This Indicator use the calculated RSI of the top 13 stocks that have the highest market capitalization in  SET50 where suitable for TFEX trading(
 S501!).
Conducted with 2 RSI period as follow:
How to use:
1) Use this Indicator by Crossover
2) Use this Indicator by Divergence of RSI Main
3) The combination of Divergence and Crossover
Preferred Timeframe
Conducted with 2 RSI period as follow:
- RSI Main (14)
- RSI Average (100)
How to use:
1) Use this Indicator by Crossover
- If the RSI Main Cross UP the RSI Average can assume as BUY SIGNAL
- If the RSI Main Cross DOWN the RSI Average can assume as SELL SIGNAL
2) Use this Indicator by Divergence of RSI Main
- If the RSI Main got any Regular Bullish or Hidden Bullish can assume as BUY SIGNAL
- If the RSI Main got any Regular Bearish or Hidden Bearish can assume as SELL SIGNAL
3) The combination of Divergence and Crossover
- If the RSI Main got any Regular Bullish or Hidden Bullish then pending for the RSI Main Cross UP the RSI Average which can assume as BUY SIGNAL
- If the RSI Main got any Regular Bearish or Hidden Bearish then pending for the RSI Main Cross DOWN the RSI Average which can assume as SELL SIGNAL
Preferred Timeframe
- 4H
- 2H
- 1H
הערות שחרור
Update name of the RSI appearance settingהערות שחרור
Add Alert Conditionsהערות שחרור
Change Calculation from SCB to EA as SCB delisted in SETהערות שחרור
Update Alert condition to have Overbought and OversoldEdit last description: Change Calculation from SCB to CPN as SCB delisted in SET
הערות שחרור
Update Chartהערות שחרור
Update NEW SET13 List- AOT
- PTT
- DELTA
- PTTEP
- BCP
- CPALL
- KBANK
- DTAC
- BBL
- BDMS
- ESSO
- KTB
- GULF
הערות שחרור
Update new stock listסקריפט קוד פתוח
ברוח האמיתית של TradingView, יוצר הסקריפט הזה הפך אותו לקוד פתוח, כך שסוחרים יוכלו לעיין בו ולאמת את פעולתו. כל הכבוד למחבר! אמנם ניתן להשתמש בו בחינם, אך זכור כי פרסום חוזר של הקוד כפוף ל־כללי הבית שלנו.
כתב ויתור
המידע והפרסומים אינם מיועדים להיות, ואינם מהווים, ייעוץ או המלצה פיננסית, השקעתית, מסחרית או מכל סוג אחר המסופקת או מאושרת על ידי TradingView. קרא עוד ב־תנאי השימוש.
סקריפט קוד פתוח
ברוח האמיתית של TradingView, יוצר הסקריפט הזה הפך אותו לקוד פתוח, כך שסוחרים יוכלו לעיין בו ולאמת את פעולתו. כל הכבוד למחבר! אמנם ניתן להשתמש בו בחינם, אך זכור כי פרסום חוזר של הקוד כפוף ל־כללי הבית שלנו.
כתב ויתור
המידע והפרסומים אינם מיועדים להיות, ואינם מהווים, ייעוץ או המלצה פיננסית, השקעתית, מסחרית או מכל סוג אחר המסופקת או מאושרת על ידי TradingView. קרא עוד ב־תנאי השימוש.