PROTECTED SOURCE SCRIPT
מעודכן EPS & Sales/Revenue Growth Marker
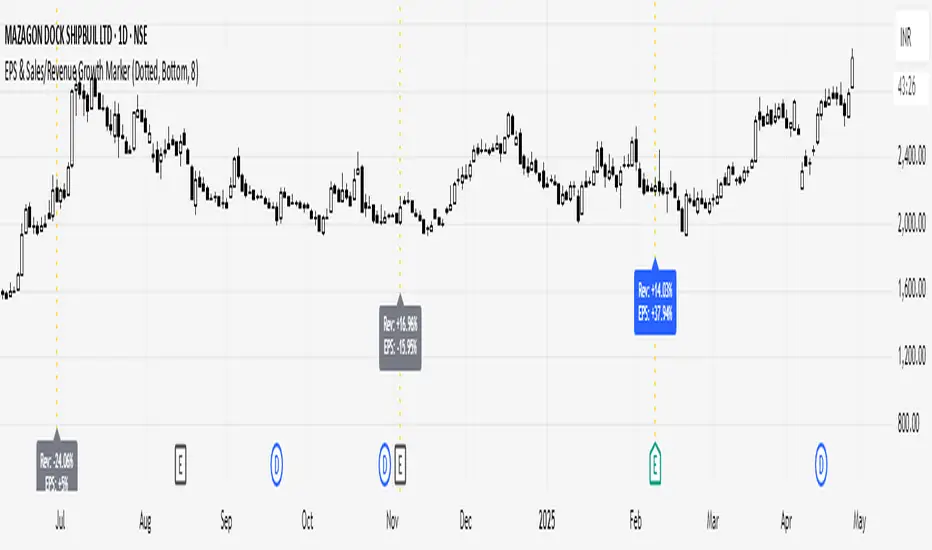
This script plots the Revenue Growth and EPS Growth % on Earnings Date.
Idea Credit: Special thanks to dharmeshrbhatt for inspiring the concept behind this tool.
Developed and Published by learningvitals.
Idea Credit: Special thanks to dharmeshrbhatt for inspiring the concept behind this tool.
Developed and Published by learningvitals.
- Plots Revenue Growth % and EPS Growth % on earnings date.
- Choose label position: Above Bar, Below Bar, Top, or Bottom.
- Customizable growth colors based on combined EPS and Revenue performance.
- Customizable line style and colors.
- Controls max number of labels to keep the chart clean.
הערות שחרור
- Added + sign display for positive Revenue Growth % and EPS Growth % values.
- No change to core functionality or layout.
הערות שחרור
Improved Detection of Earnings EventsIn this update, the script has been enhanced to detect earnings events more reliably.
Earlier, it mainly relied on official earnings data. Now, even if official earnings data is unavailable for a stock, the script can still detect earnings events using changes in financial figures like Revenue and EPS.
This ensures that the growth markers (vertical lines and labels) continue to appear consistently without missing important events, even for stocks with incomplete data.
As a result, you get better visibility of Revenue and EPS growth trends across a wider range of stocks!
סקריפט מוגן
סקריפט זה פורסם כמקור סגור. עם זאת, אתה יכול להשתמש בו באופן חופשי וללא כל הגבלה - למד עוד כאן.
כתב ויתור
המידע והפרסומים אינם אמורים להיות, ואינם מהווים, עצות פיננסיות, השקעות, מסחר או סוגים אחרים של עצות או המלצות שסופקו או מאושרים על ידי TradingView. קרא עוד בתנאים וההגבלות.
סקריפט מוגן
סקריפט זה פורסם כמקור סגור. עם זאת, אתה יכול להשתמש בו באופן חופשי וללא כל הגבלה - למד עוד כאן.
כתב ויתור
המידע והפרסומים אינם אמורים להיות, ואינם מהווים, עצות פיננסיות, השקעות, מסחר או סוגים אחרים של עצות או המלצות שסופקו או מאושרים על ידי TradingView. קרא עוד בתנאים וההגבלות.