OPEN-SOURCE SCRIPT
מעודכן Sweep + MSS

# Sweep + MSS Indicator
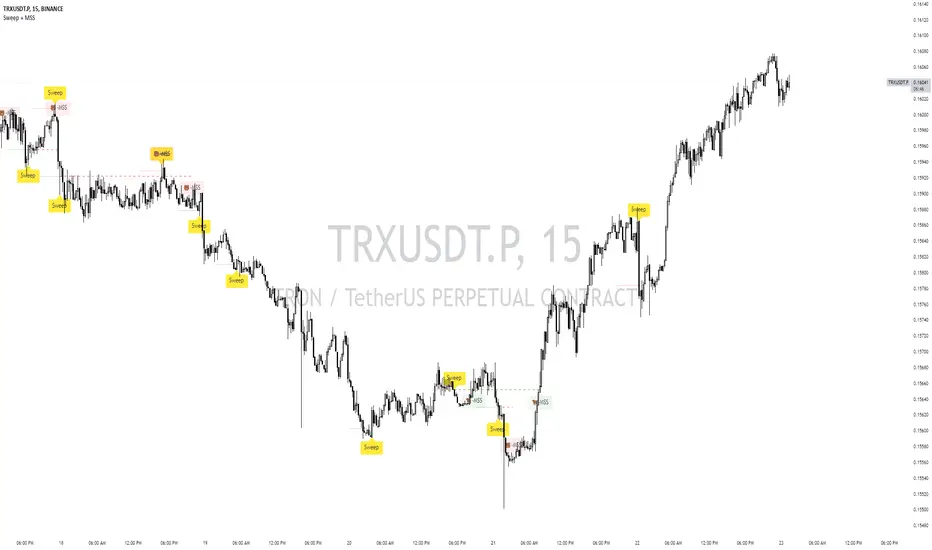
This indicator identifies market sweeps and Market Structure Shifts (MSS) to help traders recognize potential trend changes and market manipulations.
How it works:
1. Sweep Detection:
- Identifies when price briefly moves beyond a recent high/low (pivot point) and then reverses.
- Bullish sweep: Price drops below a recent low, then closes above it.
- Bearish sweep: Price rises above a recent high, then closes below it.
2. Market Structure Shift (MSS):
- Occurs when price action invalidates a previous sweep level.
- Bullish MSS: Price closes above a bearish sweep level.
- Bearish MSS: Price closes below a bullish sweep level.
Key Features:
- Customizable pivot lookback length for sweep detection
- Minimum bar requirement after a sweep before MSS can trigger
- One MSS per sweep level to avoid multiple signals
- Visual representation with lines connecting sweep points to MSS triggers
- Emoji labels for easy identification (🐂-MSS for bullish, 🐻-MSS for bearish)
Logic Behind MSS:
The MSS aims to identify potential trend changes by recognizing when the market invalidates a previous sweep level. This often indicates a shift in market structure, suggesting that the previous trend may be weakening or reversing.
- A bullish MSS occurs when the price closes above a bearish sweep level, potentially signaling a shift from bearish to bullish sentiment.
- A bearish MSS occurs when the price closes below a bullish sweep level, potentially signaling a shift from bullish to bearish sentiment.
By requiring a minimum number of bars between the sweep and the MSS, the indicator helps filter out noise and focuses on more significant structural changes in the market.
This indicator can be a valuable tool for traders looking to identify potential trend changes and entry/exit points based on market structure analysis.
הערות שחרור
- Added New Filters- Upgraded Pine Version
סקריפט קוד פתוח
ברוח האמיתית של TradingView, יוצר הסקריפט הזה הפך אותו לקוד פתוח, כך שסוחרים יוכלו לעיין בו ולאמת את פעולתו. כל הכבוד למחבר! אמנם ניתן להשתמש בו בחינם, אך זכור כי פרסום חוזר של הקוד כפוף ל־כללי הבית שלנו.
כתב ויתור
המידע והפרסומים אינם מיועדים להיות, ואינם מהווים, ייעוץ או המלצה פיננסית, השקעתית, מסחרית או מכל סוג אחר המסופקת או מאושרת על ידי TradingView. קרא עוד ב־תנאי השימוש.