OPEN-SOURCE SCRIPT
Ehlers Elegant Oscillator [CC]
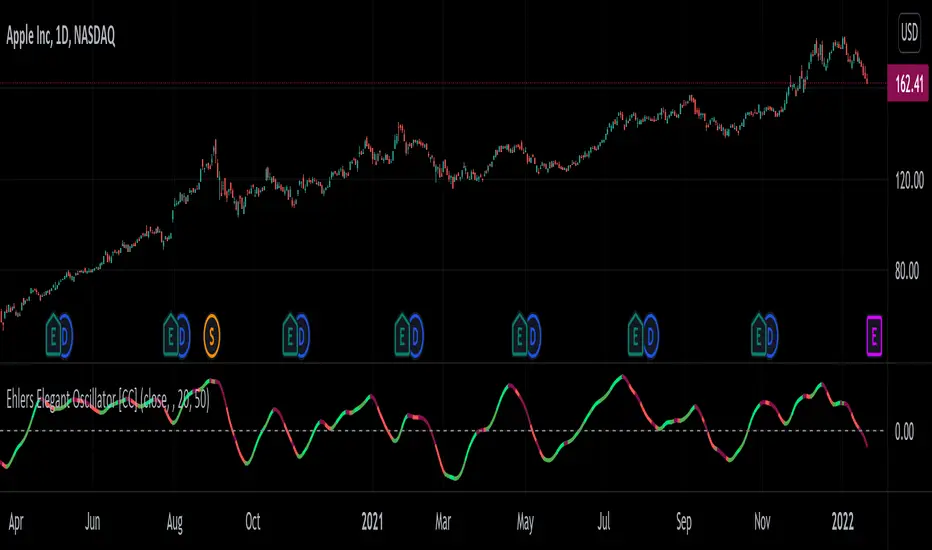
The Elegant Oscillator was created by John Ehlers (Stocks and Commodities Feb 2022 pg 21) and for those of you who don't know, he introduced the indicators for the Fisher Transform and Inverse Fisher Transform and this is a new updated version to that idea based on his latest research. This uses a soft limiter which he says is superior to a hard limiter. There are several ways to interpret this indicator. First if the indicator is above the 0 line then it is a long term bullish trend and below 0 a long term bearish trend. Second this indicator can be used for reversal points with the peaks and valleys. Finally when the indicator line starts moving higher for example it is a bullish short term trend and vice versa. I have included strong buy and sell signals in addition to normal ones so strong signals are darker in color and normal are lighter in color. Buy when the line turns green and sell when it turns red.
Let me know if there are any other indicators or scripts you would like to see me publish!
Let me know if there are any other indicators or scripts you would like to see me publish!
סקריפט קוד פתוח
ברוח האמיתית של TradingView, יוצר הסקריפט הזה הפך אותו לקוד פתוח, כך שסוחרים יוכלו לעיין בו ולאמת את פעולתו. כל הכבוד למחבר! אמנם ניתן להשתמש בו בחינם, אך זכור כי פרסום חוזר של הקוד כפוף ל־כללי הבית שלנו.
I created the largest stock indicator library:
github.com/ooples/
Custom Indicator Requests:
forms.gle/ouMffZR3dQ8bSJQG7
Tips are appreciated:
paypal.me/cheatcountry
patreon.com/cheatcountry
github.com/ooples/
Custom Indicator Requests:
forms.gle/ouMffZR3dQ8bSJQG7
Tips are appreciated:
paypal.me/cheatcountry
patreon.com/cheatcountry
כתב ויתור
המידע והפרסומים אינם מיועדים להיות, ואינם מהווים, ייעוץ או המלצה פיננסית, השקעתית, מסחרית או מכל סוג אחר המסופקת או מאושרת על ידי TradingView. קרא עוד ב־תנאי השימוש.