PROTECTED SOURCE SCRIPT
Bonds RSI

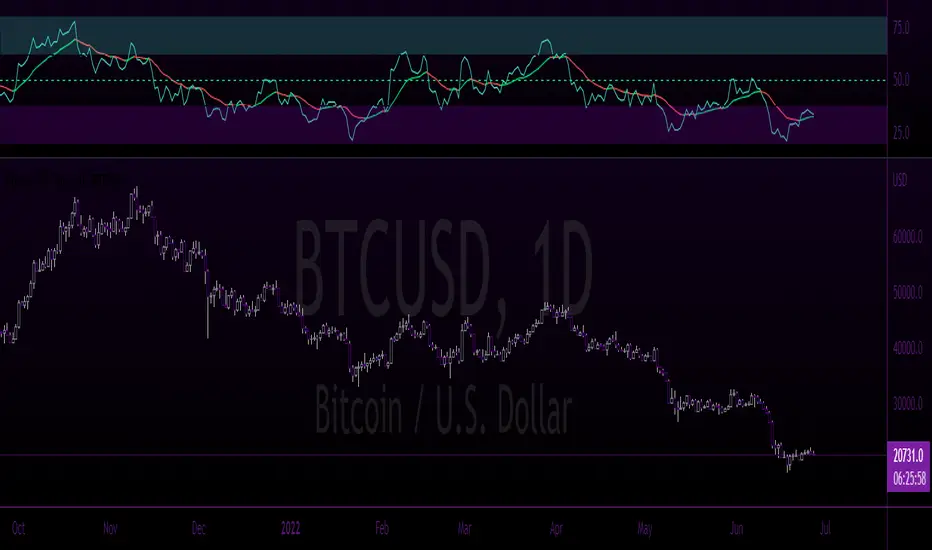
A visually appealing RSI indicator with "at a glance" visual cues to quickly and easily identify who is in control of the chart.
This indicator provides clear "Bull" and "Bear" control zones, as well as a built-in EMA that is color changing based on the trend direction.
All functions, specific data points and color themes are 100% customizable to allow the user the ability to tweak all aspects of this tool to their own liking.
As time allows I will be adding additional features & functions.
Please like & share this indicator if you find it useful.
סקריפט מוגן
סקריפט זה פורסם כמקור סגור. עם זאת, תוכל להשתמש בו בחופשיות וללא כל מגבלות – למד עוד כאן
כתב ויתור
המידע והפרסומים אינם מיועדים להיות, ואינם מהווים, ייעוץ או המלצה פיננסית, השקעתית, מסחרית או מכל סוג אחר המסופקת או מאושרת על ידי TradingView. קרא עוד ב־תנאי השימוש.
סקריפט מוגן
סקריפט זה פורסם כמקור סגור. עם זאת, תוכל להשתמש בו בחופשיות וללא כל מגבלות – למד עוד כאן
כתב ויתור
המידע והפרסומים אינם מיועדים להיות, ואינם מהווים, ייעוץ או המלצה פיננסית, השקעתית, מסחרית או מכל סוג אחר המסופקת או מאושרת על ידי TradingView. קרא עוד ב־תנאי השימוש.