OPEN-SOURCE SCRIPT
Multi Timeframe Moving Averages
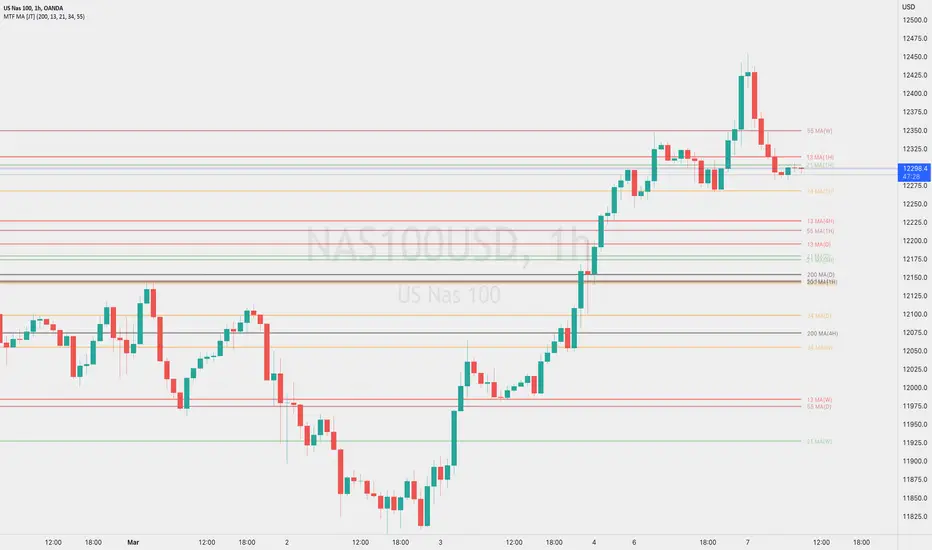
This indicator is designed to help traders analyze market trends by displaying five exponential moving averages (EMA) of their choice across four fixed intervals: weekly, daily, 4-hourly, and hourly.
The user can choose which moving averages and intervals to display, and can enable or disable these options as needed. The moving averages are drawn as lines and are updated in real-time based on the current EMA values in the respective intervals.
This indicator can help traders identify potential areas of support and resistance, as well as identify trends in the market. By displaying multiple EMAs across multiple time intervals, traders can get a more complete picture of the market and make more informed trading decisions.
סקריפט קוד פתוח
ברוח האמיתית של TradingView, יוצר הסקריפט הזה הפך אותו לקוד פתוח, כך שסוחרים יוכלו לעיין בו ולאמת את פעולתו. כל הכבוד למחבר! אמנם ניתן להשתמש בו בחינם, אך זכור כי פרסום חוזר של הקוד כפוף ל־כללי הבית שלנו.
כתב ויתור
המידע והפרסומים אינם מיועדים להיות, ואינם מהווים, ייעוץ או המלצה פיננסית, השקעתית, מסחרית או מכל סוג אחר המסופקת או מאושרת על ידי TradingView. קרא עוד ב־תנאי השימוש.