PROTECTED SOURCE SCRIPT
מעודכן Best Liquidity Indicator v0.6.3
Best Liquidity Indicator (BLI)
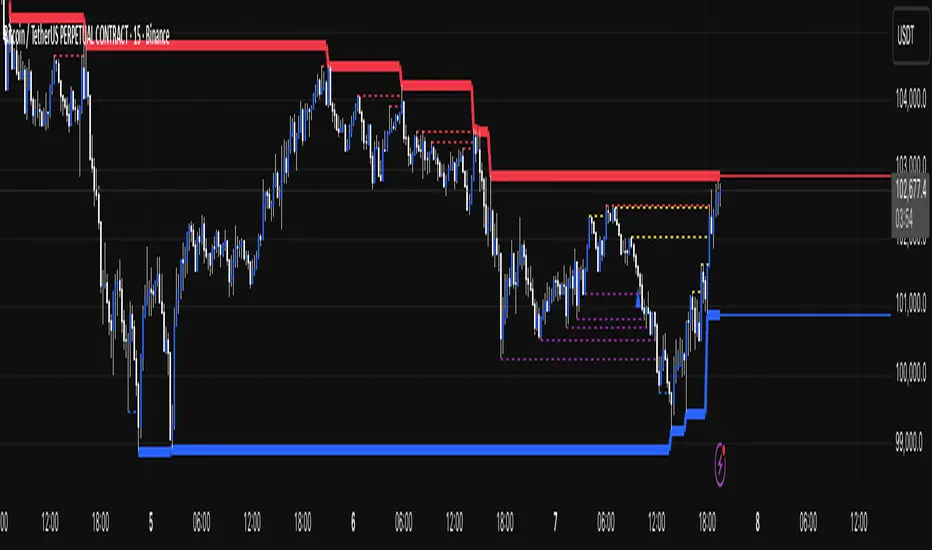
BLI maps where liquidity typically sits—and when it gets taken. It automatically draws:
BLI maps where liquidity typically sits—and when it gets taken. It automatically draws:
- Sell-side liquidity (SSL) levels and Buy-side liquidity (BSL) levels
- Liquidity grabs when price runs a level
- Ex-liquidity (invalidated/older grabs) to show the evolving path of least resistance
- (Optional) Liquidity Rails: continuous, flat “stairs” that follow only active liquidity levels to give you a smooth, higher-level read of the market’s liquidity envelope
- (Optional) the same logic from a higher timeframe (e.g., 4H) overlaid on your current chart
הערות שחרור
- Fixed issues preventing HTF liquidity levels from showing on the chart.
- Made Improvements to the Liquidity rail lines. (Further improvements to come in next version.
סקריפט מוגן
סקריפט זה פורסם כמקור סגור. עם זאת, אתה יכול להשתמש בו באופן חופשי וללא כל הגבלה - למד עוד כאן.
כתב ויתור
המידע והפרסומים אינם אמורים להיות, ואינם מהווים, עצות פיננסיות, השקעות, מסחר או סוגים אחרים של עצות או המלצות שסופקו או מאושרים על ידי TradingView. קרא עוד בתנאים וההגבלות.
סקריפט מוגן
סקריפט זה פורסם כמקור סגור. עם זאת, אתה יכול להשתמש בו באופן חופשי וללא כל הגבלה - למד עוד כאן.
כתב ויתור
המידע והפרסומים אינם אמורים להיות, ואינם מהווים, עצות פיננסיות, השקעות, מסחר או סוגים אחרים של עצות או המלצות שסופקו או מאושרים על ידי TradingView. קרא עוד בתנאים וההגבלות.