StopBuy Indicator v.3.0
Indicator «StopBuy_v.3.0»
Class: anti-indicator
Trading type: any
Time frame: any
Purpose: search for time intervals when buy trades are banned
Level of aggressiveness: standard
Indicator «StopBuy_v.3.0» belongs to a very specific group of indicators – so called anti-indicators. Their aim is not generation of trading signals, but generation of anti-signals – detection of time intervals when trading is not allowed because of a number of technical contraindications.
Despite the importance, indicators of this type are very rare. Nevertheless they are quite vital. Here are some examples:
Example 1. Buys on the top of uptrend before its reverse and start of the correction. Technical indicators like averages and trend indicators in this situation will generate buy signals. But buys on the top usually end with sufficient losses. As the result, even trading in trend can generate losses.
Example 2. Buys in the oversold zones. They look like very good trading opportunities. But in case of strong downtrend this can result significant losses.
As can be seen, strong buy signals do not necessarily mean earnings and sometimes even can lead to critical losses.
To avoid such situations anti-indicators can be used. For example indicator «StopBuy_v.3.0» generates signals which forbid buy trades.
Signals from indicator «StopBuy_v.3.0» are the result of analysis of information from different technical indicators both trend and oscillatory nature as well as information from averages.
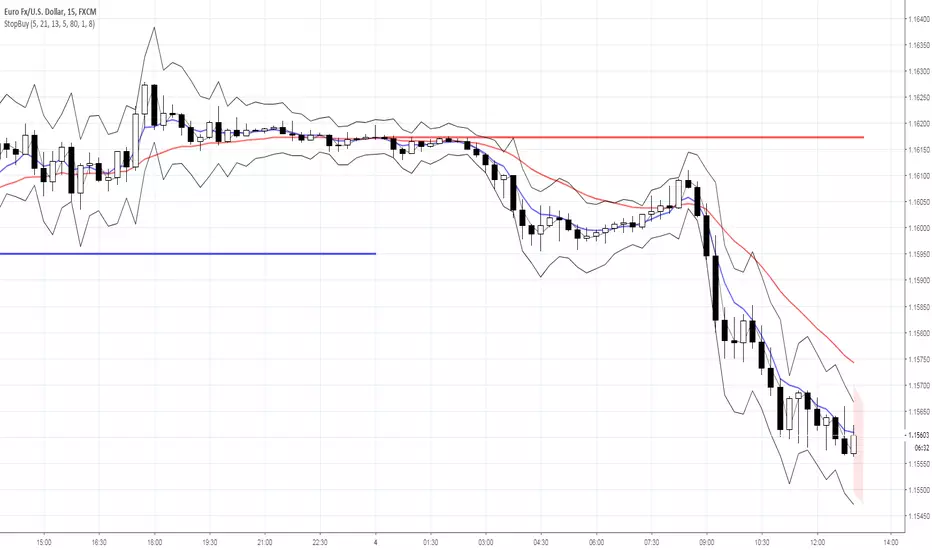
Structure of the indicator
Indicator consists of the following elements:
- green zone – signals about the absence of ban for buy trades. Is not a buy signal, so green zone shouldn’t be associated with ideal conditions for buy trades;
- red zone – shows moments when buy trades are forbidden. The most typical situations are strong overbought, presence of strong downtrend and other contraindications;
- channel lines – show price value which will not be exceeded during current time frame with probability up to 70% (this probability can be increase by adjusting «Number of deviations» parameter);
- level line (red/blue line) – shows the most likely point of price reverse. Depends on type of reverse it can be colored red (level of resistance) or blue (level of support;
- trend line (red/blue line) – shows the direction of current price dynamics using the data filtration.
Rules of trading
Rules of trading are quite easy. The presence of forbidden sign (current price is in the red zone) buy trades are not allowed. The presence of allowing sign (current price is in the green zone) is not a buy signal, this is just information that there is no ban for buy trades.
סקריפט להזמנה בלבד
רק משתמשים שאושרו על ידי המחבר יכולים לגשת לסקריפט הזה. יהיה עליך לשלוח בקשת גישה ולקבל אישור לשימוש. בדרך כלל, הגישה ניתנת לאחר תשלום. למידע נוסף, עקוב אחר ההוראות של היוצר בהמשך או צור קשר עם Trade24Fx ישירות.
TradingView לא ממליצה לשלם עבור סקריפט או להשתמש בו אלא אם כן אתה סומך לחלוטין על המחבר שלו ומבין כיצד הוא פועל. ייתכן שתוכל גם למצוא חלופות חינמיות וקוד פתוח ב-סקריפטים הקהילתיים שלנו.
הוראות המחבר
bit.ly/2oBvkHY
Больше информации на нашем ютьюб-канале
youtube.com/channel/UCYEOurJfasXWyYnrriGwsqQ
כתב ויתור
סקריפט להזמנה בלבד
רק משתמשים שאושרו על ידי המחבר יכולים לגשת לסקריפט הזה. יהיה עליך לשלוח בקשת גישה ולקבל אישור לשימוש. בדרך כלל, הגישה ניתנת לאחר תשלום. למידע נוסף, עקוב אחר ההוראות של היוצר בהמשך או צור קשר עם Trade24Fx ישירות.
TradingView לא ממליצה לשלם עבור סקריפט או להשתמש בו אלא אם כן אתה סומך לחלוטין על המחבר שלו ומבין כיצד הוא פועל. ייתכן שתוכל גם למצוא חלופות חינמיות וקוד פתוח ב-סקריפטים הקהילתיים שלנו.
הוראות המחבר
bit.ly/2oBvkHY
Больше информации на нашем ютьюб-канале
youtube.com/channel/UCYEOurJfasXWyYnrriGwsqQ