OPEN-SOURCE SCRIPT
Different Donchian Periods
Hi!
This is a very simple script that I couldn't find on TradingView yet. Look at this indicator how you want (band, cloud, ma's) and create your own settings, I did not test it.
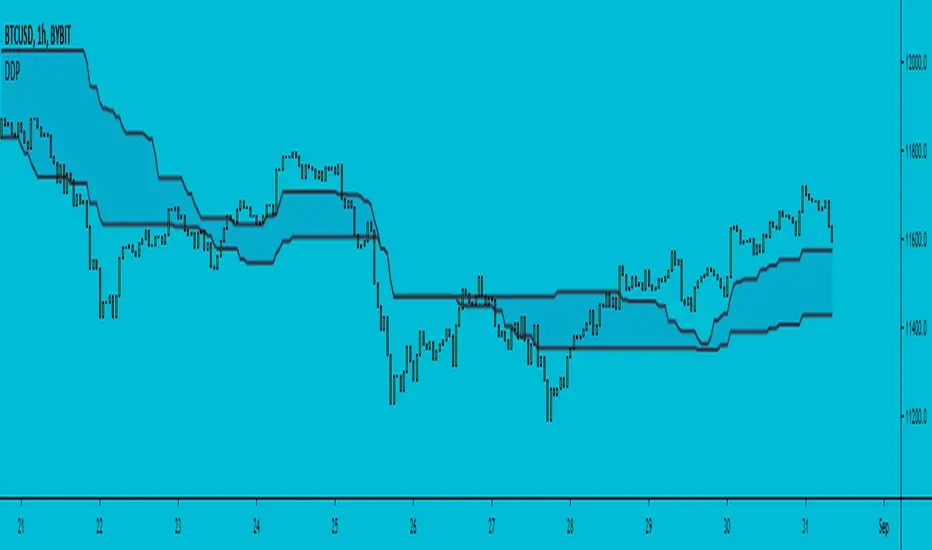
Normally, Donchian average calculates the average(middle) of the highest point of a given period and the lowest point of that same period.
Here I use two separate periods, one for highest, a different one for lowest. That's it :)
Let me know if it's useful to you, I appreciate your comments.
This is a very simple script that I couldn't find on TradingView yet. Look at this indicator how you want (band, cloud, ma's) and create your own settings, I did not test it.
Normally, Donchian average calculates the average(middle) of the highest point of a given period and the lowest point of that same period.
Here I use two separate periods, one for highest, a different one for lowest. That's it :)
Let me know if it's useful to you, I appreciate your comments.
סקריפט קוד פתוח
ברוח האמיתית של TradingView, יוצר הסקריפט הזה הפך אותו לקוד פתוח, כך שסוחרים יוכלו לעיין בו ולאמת את פעולתו. כל הכבוד למחבר! אמנם ניתן להשתמש בו בחינם, אך זכור כי פרסום חוזר של הקוד כפוף ל־כללי הבית שלנו.
כתב ויתור
המידע והפרסומים אינם מיועדים להיות, ואינם מהווים, ייעוץ או המלצה פיננסית, השקעתית, מסחרית או מכל סוג אחר המסופקת או מאושרת על ידי TradingView. קרא עוד ב־תנאי השימוש.