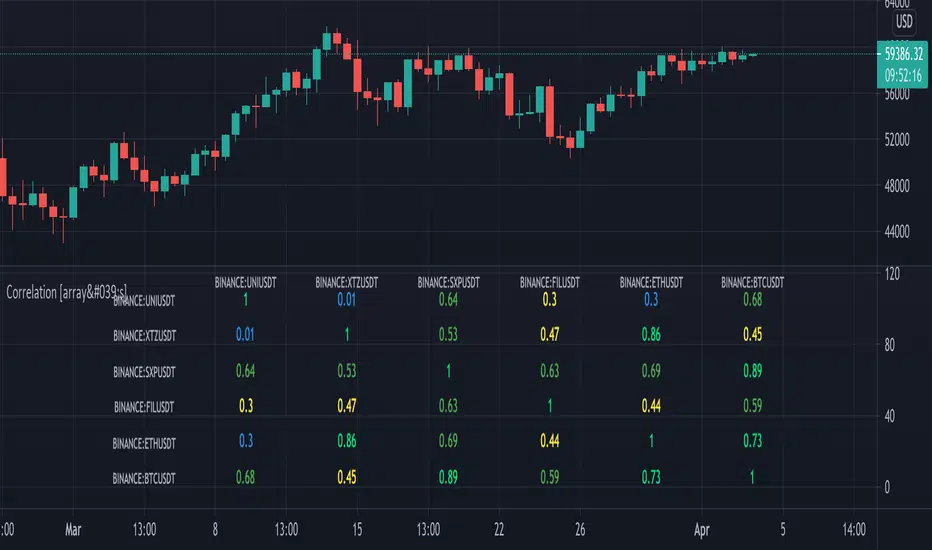
This script isn't about creating a correlation script with labels, there is a perfect working example of Mango2Juice
(Correlation Matrix, which was inspired by Daveatt's Correlation Matrix)
The intention was making it with the use of as less code as possible, looping through array's
The Pine correlation function doesn't work consistently in a local scope (loop), so I had to work around it
Inspired by ZenAndTheArtOfTrading's Correlation Meter (using array.covariance and array.stdev) and
especially with the help of RicardoSantos and LonesomeTheBlue I've managed to do this
Symbols, timeframe, look-back period, colors and limits can be changed
There is always room for improvement, but I think it shows what is possible.
Many thanks to the people who I've mentioned, and of course to Tradingview!
(Without the Earth nothing can grow)
Cheers!
סקריפט קוד פתוח
ברוח האמיתית של TradingView, יוצר הסקריפט הזה הפך אותו לקוד פתוח, כך שסוחרים יוכלו לעיין בו ולאמת את פעולתו. כל הכבוד למחבר! אמנם ניתן להשתמש בו בחינם, אך זכור כי פרסום חוזר של הקוד כפוף ל־כללי הבית שלנו.
Who are PineCoders?
tradingview.com/chart/SSP/yW5eOqtm-Who-are-PineCoders/
TG Pine Script® Q&A: t.me/PineCodersQA
- We cannot control our emotions,
but we can control our keyboard -
tradingview.com/chart/SSP/yW5eOqtm-Who-are-PineCoders/
TG Pine Script® Q&A: t.me/PineCodersQA
- We cannot control our emotions,
but we can control our keyboard -
כתב ויתור
המידע והפרסומים אינם מיועדים להיות, ואינם מהווים, ייעוץ או המלצה פיננסית, השקעתית, מסחרית או מכל סוג אחר המסופקת או מאושרת על ידי TradingView. קרא עוד ב־תנאי השימוש.
