PROTECTED SOURCE SCRIPT
מעודכן Six Sigma Enhanced
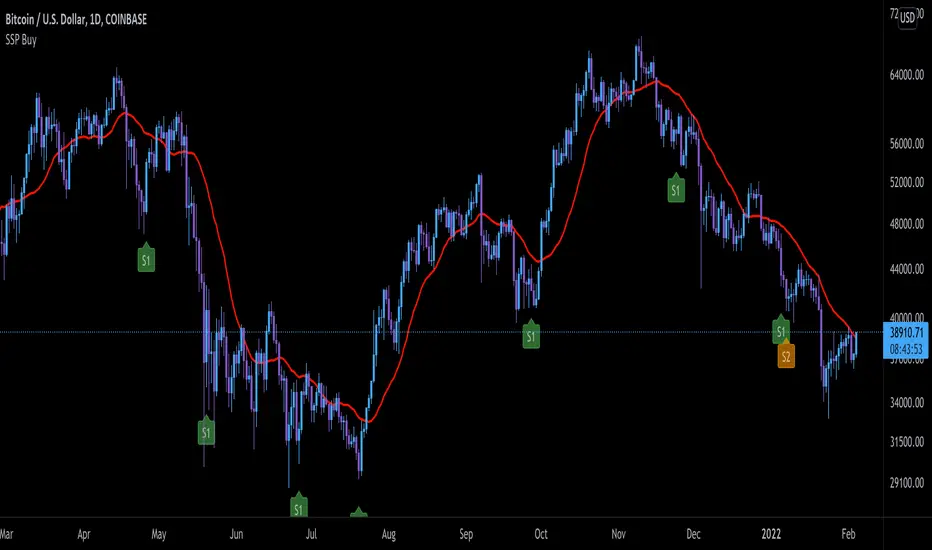
This script is a study of the Two Six Sigma patterns explored in the December 2018 issue of Technical Analysis of Stocks & Commodities (Stocks & Commodities V. 36:12 (8–12): Identifying High-Probability Buy Signals by François Picard, MS , & Edmond Miresco, PhD )
Signal 1 - 9 Closes Under MA
The first (Signal #1 or S1 on the chart) indicates 9 consecutive closes below the 20-period moving average. In the study, the authors used a simple moving average however I have modified it to use a MA to account for price distribution
Signal 2 - 6 Lower Closes and 9 Closes Under MA
The second signal (Signal #2 or S2 on the chart) indicates six consecutive periods where the close value is lower than the previous close and Signal 1.
Filter Signal Code provided by tradingview.com/u/AllTradeSignals/
הערות שחרור
SMA is used to calculate plot lineהערות שחרור
migrated to v5סקריפט מוגן
סקריפט זה פורסם כמקור סגור. עם זאת, תוכל להשתמש בו בחופשיות וללא כל מגבלות – למד עוד כאן
כתב ויתור
המידע והפרסומים אינם מיועדים להיות, ואינם מהווים, ייעוץ או המלצה פיננסית, השקעתית, מסחרית או מכל סוג אחר המסופקת או מאושרת על ידי TradingView. קרא עוד ב־תנאי השימוש.
סקריפט מוגן
סקריפט זה פורסם כמקור סגור. עם זאת, תוכל להשתמש בו בחופשיות וללא כל מגבלות – למד עוד כאן
כתב ויתור
המידע והפרסומים אינם מיועדים להיות, ואינם מהווים, ייעוץ או המלצה פיננסית, השקעתית, מסחרית או מכל סוג אחר המסופקת או מאושרת על ידי TradingView. קרא עוד ב־תנאי השימוש.