OPEN-SOURCE SCRIPT
Quick-Glance RSI

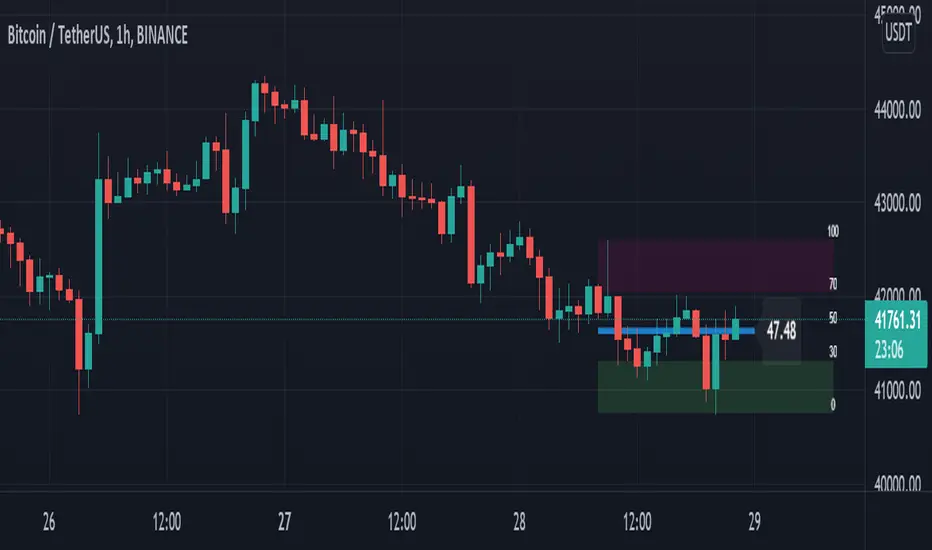
This script will draw a live, updating-RSI on the main chart. As the price updates, the RSI line will self-adjust between the highest high an the lowest low for the RSI period.
Settings/Customizations:
RSI Length: Calculate RSI and draw RSI Line for specified period
Overbought Level: Draw maroon box from OB level to highest high.
Oversold Level: Draw green box from lowest low to OS level.
Scale Offset: Fine-tune location of 0-100 scale.
Show Scale: Draw 0-100 levels to the right of the RSI line.
Show RSI Line: Draw a line from the start of the RSI period to the current price.
Show OB/OS Boxes: Enable or disable background for overbought and oversold areas.
Realtime: Draw all data in real time.

RSI on overlay chart is same as current RSI on bottom chart

RSI without scale, boxes, or RSI Line
“Repainting” Note: The current RSI level is calculated in real time as each price changes, so yes this does “repaint” on the current bar. This is by design and will not change the effectiveness of the script. However, if you are using this script to generate signals, uncheck “Realtime” and/or use “once per bar close” for alerts.
Settings/Customizations:
RSI Length: Calculate RSI and draw RSI Line for specified period
Overbought Level: Draw maroon box from OB level to highest high.
Oversold Level: Draw green box from lowest low to OS level.
Scale Offset: Fine-tune location of 0-100 scale.
Show Scale: Draw 0-100 levels to the right of the RSI line.
Show RSI Line: Draw a line from the start of the RSI period to the current price.
Show OB/OS Boxes: Enable or disable background for overbought and oversold areas.
Realtime: Draw all data in real time.
RSI on overlay chart is same as current RSI on bottom chart
RSI without scale, boxes, or RSI Line
“Repainting” Note: The current RSI level is calculated in real time as each price changes, so yes this does “repaint” on the current bar. This is by design and will not change the effectiveness of the script. However, if you are using this script to generate signals, uncheck “Realtime” and/or use “once per bar close” for alerts.
סקריפט קוד פתוח
ברוח האמיתית של TradingView, יוצר הסקריפט הזה הפך אותו לקוד פתוח, כך שסוחרים יוכלו לעיין בו ולאמת את פעולתו. כל הכבוד למחבר! אמנם ניתן להשתמש בו בחינם, אך זכור כי פרסום חוזר של הקוד כפוף ל־כללי הבית שלנו.
USDT(ERC20):0x89c1ada92d53e88a06131a28693fd46101bdbecb
LTC:LWx9nAqbfZcWB5GBxUuBEpdBCFyVAmSFjm
ETH(ERC20):0x89c1ada92d53e88a06131a28693fd46101bdbecb
BTC:113pXq5Lxdp3UUgTpRng24sxX7YRE9dR61p
LTC:LWx9nAqbfZcWB5GBxUuBEpdBCFyVAmSFjm
ETH(ERC20):0x89c1ada92d53e88a06131a28693fd46101bdbecb
BTC:113pXq5Lxdp3UUgTpRng24sxX7YRE9dR61p
כתב ויתור
המידע והפרסומים אינם מיועדים להיות, ואינם מהווים, ייעוץ או המלצה פיננסית, השקעתית, מסחרית או מכל סוג אחר המסופקת או מאושרת על ידי TradingView. קרא עוד ב־תנאי השימוש.