OPEN-SOURCE SCRIPT
MCDX Plus - Leading Banker with Ichimoku (Swing Opt)
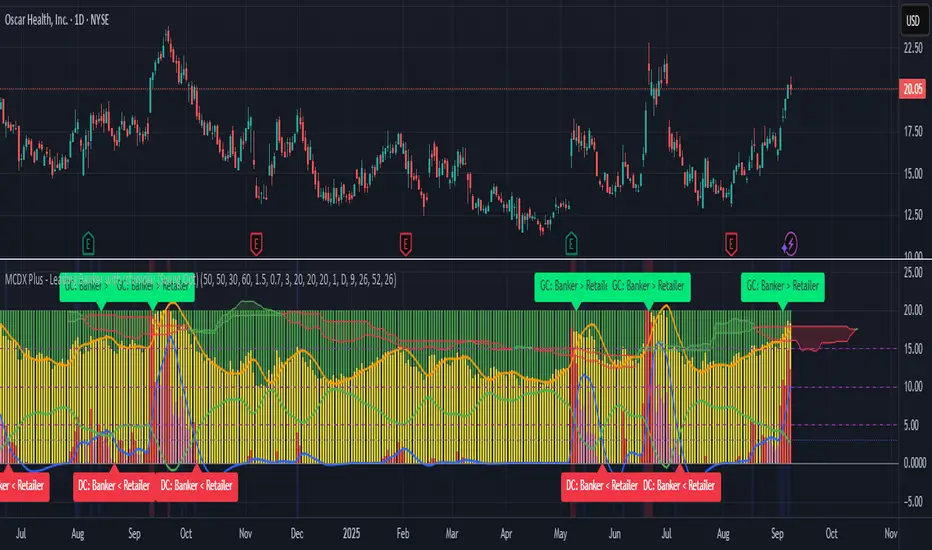
Understanding the Indicator
Components:
Green Bars (Retailer): Inverse on top (stacked from 20 downward), represent retail momentum. High values (>15) with a lime background signal retail dominance—often a sell or avoid zone.
Yellow Bars (Hot Money): Middle layer, indicate speculative momentum. Useful as a secondary confirmation.
Red/Fuchsia Bars (Banker): Bottom layer, show institutional (banker/hedge fund) momentum. Red when RSI_Banker ≥ BankerMA, fuchsia otherwise. Crossings above 5, 10, 15 are key buy signals.
Blue Line (Banker MA): Hull Moving Average (HMA) of Banker RSI, tracks institutional trend with minimal lag.
Orange Line (Hot Money MA): HMA of Hot Money RSI.
Green Line (Retailer MA): HMA of Retailer RSI.
Reference Lines: 0 (base), 5 (25% Banker Entry), 10 (50% Banker Building), 15 (75% Banker Control), buildThreshold (2.0 for early signals).
Backgrounds: Red (RSI_Banker > 15, strong buy), Lime (RSI_Retailer > 15, sell/avoid), Blue (earlyBuildSignal, potential entry).
Precision Features:
HMAs reduce lag for faster cross signals.
Shortened MA periods (default 8) align with quick price moves.
PriceEMA (50-period) filters entries/exits with trend confirmation.
Pro-Level Usage Strategy
1. Master Entry Timing
Signal: Look for a Golden Cross (Banker MA crosses above Retailer MA or Hot Money MA) + red bars >5 + price > priceEMA (50-period EMA of close) + blue background (earlyBuildSignal).
Why It Works: The HMA’s low lag catches early institutional buying (red bars rising), while price > priceEMA confirms an uptrend. The blue background (RSI_Banker > 2, positive ROC, volume > volMA) flags pre-breakout accumulation.
Pro Action:
Enter a small position on the Golden Cross with blue background.
Add to the position as red bars hit 10, confirmed by volume spikes (volume > volMA).
Set a stop-loss 2-3% below the recent low or the 20-period price EMA.
Target a take-profit at 10-15% or when red bars approach 15.
2. Nail Exit Timing
Signal: Look for a Dead Cross (Banker MA crosses below Retailer MA or Hot Money MA) + green bars >15 + price < priceEMA + lime background.
Why It Works: The HMA’s precision flags waning institutional interest (red bars falling), while green bars >15 and a lime background indicate retail overextension—a classic reversal point. Price < priceEMA confirms a downtrend.
Pro Action:
Exit partial profits on the Dead Cross if red bars drop below 10.
Full exit when green bars >15 and lime background appear, with a stop-loss moved to break-even.
Target a re-entry on the next Golden Cross if red bars recover.
3. Use Cross Signals as Triggers
Golden Cross (Buy): Banker MA > Retailer MA or Hot Money MA. Confirm with red bars >5 and price > priceEMA.
Dead Cross (Sell/Avoid): Banker MA < Retailer MA or Hot Money MA. Confirm with green bars >15 and price < priceEMA.
Pro Action:
Set TradingView alerts for these conditions (e.g., "GC: Banker > Retailer MA and Price > EMA50" for buy).
Use multiple timeframes (e.g., 1H for entry, 4H for exit) to filter noise.
Combine with candlestick patterns (e.g., bullish engulfing for entry) for confirmation.
4. Leverage Backgrounds for Momentum
Red Background (RSI_Banker > 15): Strong institutional control—hold or add to longs.
Lime Background (RSI_Retailer > 15): Retail dominance—exit or short (if your broker allows).
Blue Background (earlyBuildSignal): Early banker accumulation—prepare for entry, watch for Golden Cross.
Pro Action:
Scale into trades during red zones, scale out in lime zones.
Use blue zones to anticipate breakouts, entering only after cross confirmation.
5. Optimize with Volume and Price
Volume Confirmation: Enter only when volume > volMA (10-period SMA) during Golden Cross or red bar rises.
Price Action: Align entries with support/resistance breaks, exits with trendline breaks.
Pro Action:
Add a volume oscillator (e.g., OBV) to your chart to confirm spikes.
Use Fibonacci retracement (e.g., 50% level) with MCDX signals for precise targets.
6. Pro Risk Management
Position Sizing: Risk 1-2% of capital per trade, adjusting based on red bar height (e.g., larger size at 15).
Stop-Loss: Dynamic—below recent low for entries, above recent high for exits, or trailing 2% below price EMA.
Take-Profit: Scale out at 5-10-15 red bar levels or key price targets (e.g., 20% gain).
Risk-Reward: Aim for 1:3 or better, validated by backtesting.
Ichimoku Cloud
What It Does: Combines five lines—Tenkan-sen (conversion line), Kijun-sen (base line), Senkou Span A/B (cloud edges), and Chikou Span (lagging span)—to provide trend direction, support/resistance, and momentum. The cloud (area between Span A and B) acts as a dynamic zone to filter trades.
Benefits for MCDX Plus:
Trend Confirmation: Entry is stronger when a Golden Cross (Banker MA > Retailer MA) occurs above the cloud (bullish), or exit on Dead Cross below the cloud (bearish). This aligns with priceEMA (50-period) filtering.
Support/Resistance: The cloud’s edges (e.g., Senkou Span B) can act as profit targets or stop-loss levels, enhancing precision on CleanSpark’s sharp moves.
Leading Edge: The Tenkan-sen (default 9-period) and Kijun-sen (default 26-period) cross can signal momentum shifts before MCDX crosses, complementing the blue earlyBuildSignal.
Visual Clarity: Adds a contextual layer to your chart, making it easier to see if red bars >5 align with a bullish cloud breakout.
Drawbacks:
Complexity: Requires learning (e.g., cloud thickness indicates strength), which might clutter your workflow if you’re focused solely on red bars.
Lag in Volatile Markets: The cloud’s 26-period base can lag in fast reversals
Best For: Swing traders or those wanting a holistic trend filter. Backtests on similar scripts (e.g., Smart Money Flow Pro + Ichimoku) show 70-80% accuracy when cloud aligns with MCDX signals.
סקריפט קוד פתוח
ברוח TradingView אמיתית, היוצר של הסקריפט הזה הפך אותו לקוד פתוח, כך שסוחרים יכולים לבדוק ולאמת את הפונקציונליות שלו. כל הכבוד למחבר! למרות שאתה יכול להשתמש בו בחינם, זכור שפרסום מחדש של הקוד כפוף לכללי הבית שלנו.
כתב ויתור
המידע והפרסומים אינם אמורים להיות, ואינם מהווים, עצות פיננסיות, השקעות, מסחר או סוגים אחרים של עצות או המלצות שסופקו או מאושרים על ידי TradingView. קרא עוד בתנאים וההגבלות.