PROTECTED SOURCE SCRIPT
SG Momentum
Hello All,
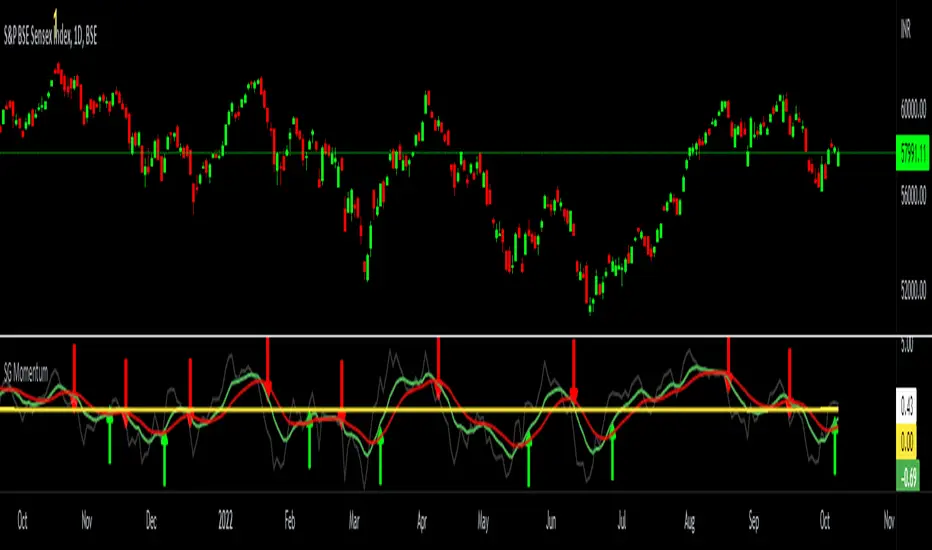
I have made a momentum indicator based on the distance from exponential moving average. This captures both buy and sell cycles effectively. The logic is to calculate the distance of closing price from an exponential moving average ( I use 13 period - You are free to choose any other period) - this is the dim grey line which you can toggle off too. Then I smoothen this by calculating a 9-period EMA of the same (the green line). I further slow it down by another 9-period EMA of the same ( the red line). Now when the green lines crosses the red line from below 0 it signifies a new bull cycle and vice versa for bear cycle. This works across all timeframes. I have marked few signals in the below chart for your reference.

I have made a momentum indicator based on the distance from exponential moving average. This captures both buy and sell cycles effectively. The logic is to calculate the distance of closing price from an exponential moving average ( I use 13 period - You are free to choose any other period) - this is the dim grey line which you can toggle off too. Then I smoothen this by calculating a 9-period EMA of the same (the green line). I further slow it down by another 9-period EMA of the same ( the red line). Now when the green lines crosses the red line from below 0 it signifies a new bull cycle and vice versa for bear cycle. This works across all timeframes. I have marked few signals in the below chart for your reference.
סקריפט מוגן
סקריפט זה פורסם כמקור סגור. עם זאת, תוכל להשתמש בו בחופשיות וללא כל מגבלות – למד עוד כאן
כתב ויתור
המידע והפרסומים אינם מיועדים להיות, ואינם מהווים, ייעוץ או המלצה פיננסית, השקעתית, מסחרית או מכל סוג אחר המסופקת או מאושרת על ידי TradingView. קרא עוד ב־תנאי השימוש.
סקריפט מוגן
סקריפט זה פורסם כמקור סגור. עם זאת, תוכל להשתמש בו בחופשיות וללא כל מגבלות – למד עוד כאן
כתב ויתור
המידע והפרסומים אינם מיועדים להיות, ואינם מהווים, ייעוץ או המלצה פיננסית, השקעתית, מסחרית או מכל סוג אחר המסופקת או מאושרת על ידי TradingView. קרא עוד ב־תנאי השימוש.