OPEN-SOURCE SCRIPT
מעודכן KINSKI ADX

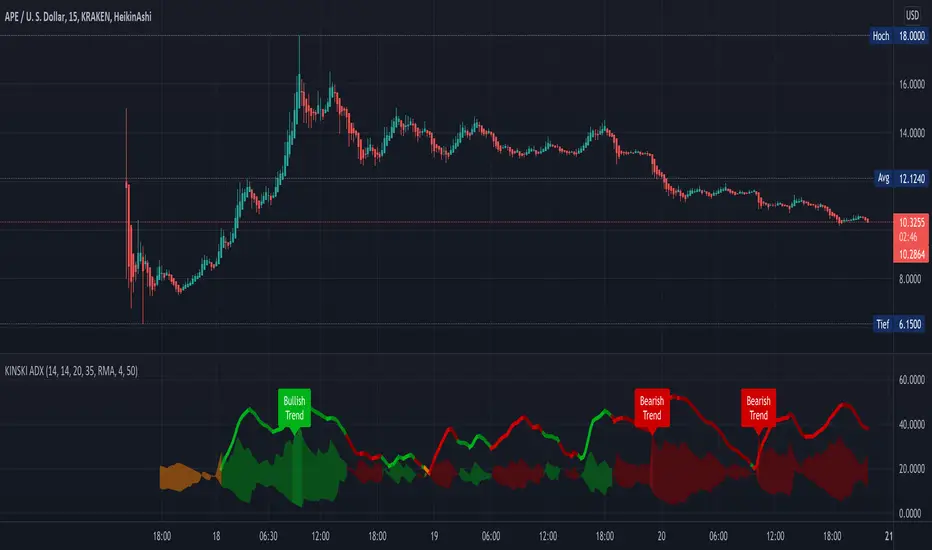
This ADX indicator (Average Directional Index) tries to estimate the strength of a trend. The Average Directional Index is derived from the positive (+DI) and the negative directional indicator (-DI). The direction of movement is determined by comparing the highs and lows of the current and past periods.
As soon as the indicator determines a trend strength for upward or downward trend, a label is displayed. An upward trend is labelled "Bullish Trend". The downward trend bears the label "Bearish Trend".
The clouds in the background represent the movements of the Average Directional Index High/Low:
The line represents the average value of the ADX signal:
The following configurable options are possible:
As soon as the indicator determines a trend strength for upward or downward trend, a label is displayed. An upward trend is labelled "Bullish Trend". The downward trend bears the label "Bearish Trend".
The clouds in the background represent the movements of the Average Directional Index High/Low:
- Color orange: neutral, uncertain in which direction it is going.
- Color green: upward trend
- Color red: downward trend
The line represents the average value of the ADX signal:
- Color orange: neutral: still uncertain in which direction it is going
- Color green / outgoing line: upward trend
- Color green / descending line: weakening upward trend
- Color red / exiting line: downward trend
- Color red / descending line: weakening downward trend
The following configurable options are possible:
- "ADX Smoothing
- Directional Index Length
- Level Range
- Level Trend
הערות שחרור
Here's a nice little update on that. Normally the ADX calculations are calculated with the moving average "Running Moving Average (RMA)". Under the settings you can now select different MA types via the option "Type of Moving Average". With this new, interesting possibilities are then available.Selectable MA variants:
"COVWMA", "DEMA", "EMA", "EHMA", "FRAMA", "HMA", "KAMA", "RMA", "SMA", "SMMA", "VIDYA", "VWMA", "WMA"
הערות שחרור
- Convert to PineScript5
הערות שחרור
- add Style Options
- add new MA Types => "TEMA" (Triple EMA), "Karobein"
הערות שחרור
- Refactor Code
סקריפט קוד פתוח
ברוח האמיתית של TradingView, יוצר הסקריפט הזה הפך אותו לקוד פתוח, כך שסוחרים יוכלו לעיין בו ולאמת את פעולתו. כל הכבוד למחבר! אמנם ניתן להשתמש בו בחינם, אך זכור כי פרסום חוזר של הקוד כפוף ל־כללי הבית שלנו.
My published Scripts:
de.tradingview.com/u/KINSKI/
Appreciation of my work: paypal.com/paypalme/steffenhollstein
de.tradingview.com/u/KINSKI/
Appreciation of my work: paypal.com/paypalme/steffenhollstein
כתב ויתור
המידע והפרסומים אינם מיועדים להיות, ואינם מהווים, ייעוץ או המלצה פיננסית, השקעתית, מסחרית או מכל סוג אחר המסופקת או מאושרת על ידי TradingView. קרא עוד ב־תנאי השימוש.