OPEN-SOURCE SCRIPT
Future Pivots CPR - All Timeframes

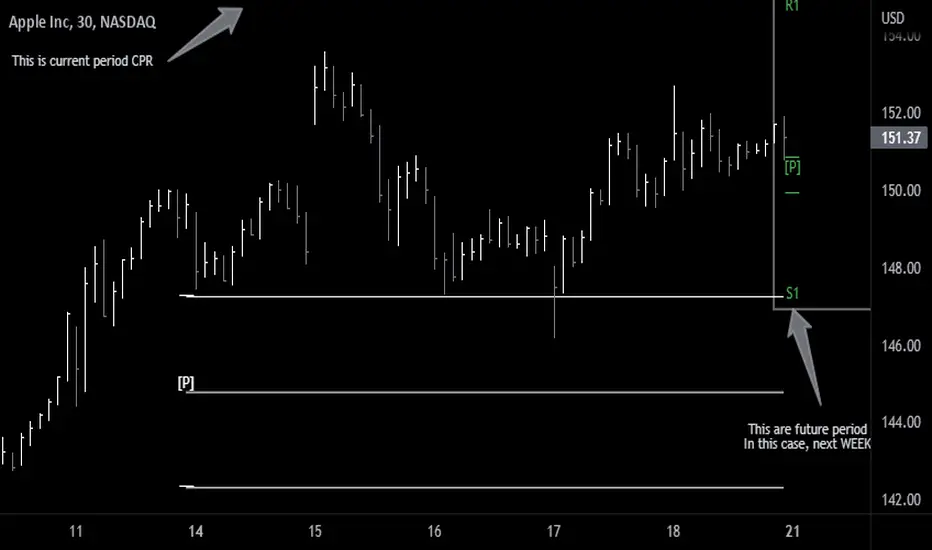
Simple idea that allows you to display tomorrow CPR/ Standard Floor Trader Pivots based on the high, low and close of today session. Likewise, it works for higher timeframes taking into account the high, low, close of the period (e.g. weekly, monthly, year).
Just be aware that -regardless of the timeframe- if the period is still in development, the indicator will constantly/ live update the values until the period is closed!! This indicator is meant to be used when preparing for the next trading period. If you want to use it live, I'd suggest using the function of this indicator which allows to display only current/closed pivots-
Similar to other script I published, this indicator lower timeframes (Daily and Weekly) will work with lower timeframe bars, this is the Minutes and Hour bars. Conversely, higher timeframe CPR/Pivots will work better with timeframes/charts from Daily and above.
Available tick/untick functions:
- Select timeframe
- Show current CPR & Support/Resistance
- Show tomorrow CPR & Support/Resistance
- Display historical CPR (CPR only)
- Show extended support and resistance lines (S2,S3,R2,R3) for current and future pivots.
סקריפט קוד פתוח
ברוח האמיתית של TradingView, יוצר הסקריפט הזה הפך אותו לקוד פתוח, כך שסוחרים יוכלו לעיין בו ולאמת את פעולתו. כל הכבוד למחבר! אמנם ניתן להשתמש בו בחינם, אך זכור כי פרסום חוזר של הקוד כפוף ל־כללי הבית שלנו.
כתב ויתור
המידע והפרסומים אינם מיועדים להיות, ואינם מהווים, ייעוץ או המלצה פיננסית, השקעתית, מסחרית או מכל סוג אחר המסופקת או מאושרת על ידי TradingView. קרא עוד ב־תנאי השימוש.