OPEN-SOURCE SCRIPT
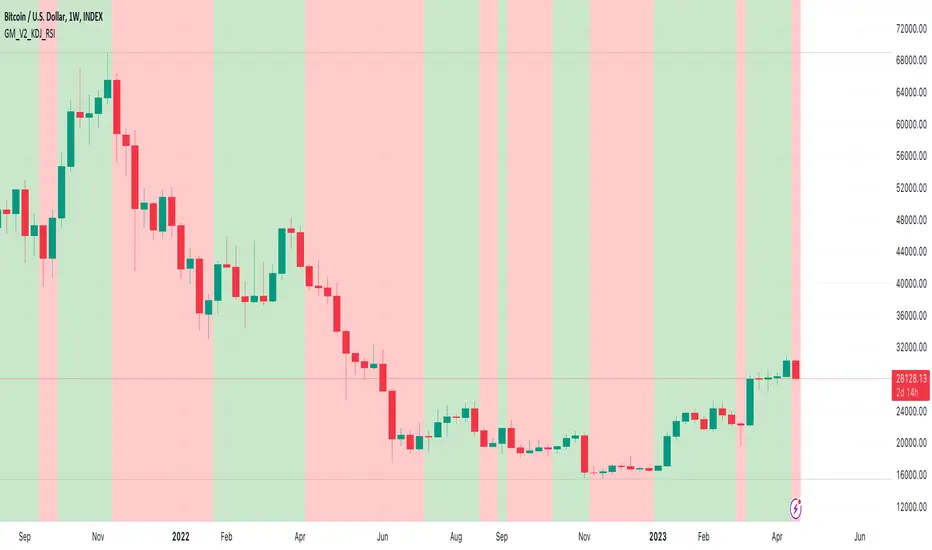
KDJ Indicator with RSI Filter

The KDJ indicator is a technical analysis tool used by traders to identify potential buy and sell signals in financial markets. It is an extension of the Stochastic Oscillator, which consists of two lines, %K and %D, that move within a range of 0 to 100. The KDJ indicator introduces a third line, called %J, which is derived from the %K and %D lines. The KDJ indicator is primarily used to identify overbought and oversold conditions, as well as potential trend reversals.
Here's a brief overview of the KDJ indicator's components:
%K line: It is calculated by comparing the current closing price to the range of high and low prices over a specific period (usually 9 days).
%D line: It is a moving average of the %K line
%J line: It is calculated using the %K and %D lines
The KDJ indicator generates buy signals when the %K line crosses above the %D line and sell signals when the %K line crosses below the %D line. Additionally, when the %J line is above 100, it suggests that the asset is overbought, and when the %J line is below 0, it suggests that the asset is oversold. Traders often use these overbought and oversold signals to identify potential trend reversals.
I have taken KDJ script from and added RSI filter and alerts with and without RSI filter.
I was requested to create this script with alerts. And here it is. I have added alerts. And, I have added abilities to turn on and off the RSI filters from settings.
Here's a brief overview of the KDJ indicator's components:
%K line: It is calculated by comparing the current closing price to the range of high and low prices over a specific period (usually 9 days).
%D line: It is a moving average of the %K line
%J line: It is calculated using the %K and %D lines
The KDJ indicator generates buy signals when the %K line crosses above the %D line and sell signals when the %K line crosses below the %D line. Additionally, when the %J line is above 100, it suggests that the asset is overbought, and when the %J line is below 0, it suggests that the asset is oversold. Traders often use these overbought and oversold signals to identify potential trend reversals.
I have taken KDJ script from

I was requested to create this script with alerts. And here it is. I have added alerts. And, I have added abilities to turn on and off the RSI filters from settings.
סקריפט קוד פתוח
ברוח האמיתית של TradingView, יוצר הסקריפט הזה הפך אותו לקוד פתוח, כך שסוחרים יוכלו לעיין בו ולאמת את פעולתו. כל הכבוד למחבר! אמנם ניתן להשתמש בו בחינם, אך זכור כי פרסום חוזר של הקוד כפוף ל־כללי הבית שלנו.
For guides on how to use the Aladdin indicator or how to buy it, please check joy-bangla.gitbook.io/aladdin/
כתב ויתור
המידע והפרסומים אינם מיועדים להיות, ואינם מהווים, ייעוץ או המלצה פיננסית, השקעתית, מסחרית או מכל סוג אחר המסופקת או מאושרת על ידי TradingView. קרא עוד ב־תנאי השימוש.