OPEN-SOURCE SCRIPT
Andean Oscillator (Version 3.0 Sr.K)
Andean Oscillator (Version 3.0 Sr.K)
This indicator is a momentum-based oscillator that measures the balance between bullish and bearish pressure.
🔧 How it works:
It calculates two adaptive envelopes around price and derives a "bullish" and "bearish" component.
The oscillator value is simply Bull - Bear, showing which side dominates.
A signal line (EMA of the oscillator) smooths the raw value.
Optionally, ±1σ levels are plotted to highlight statistically strong moves.
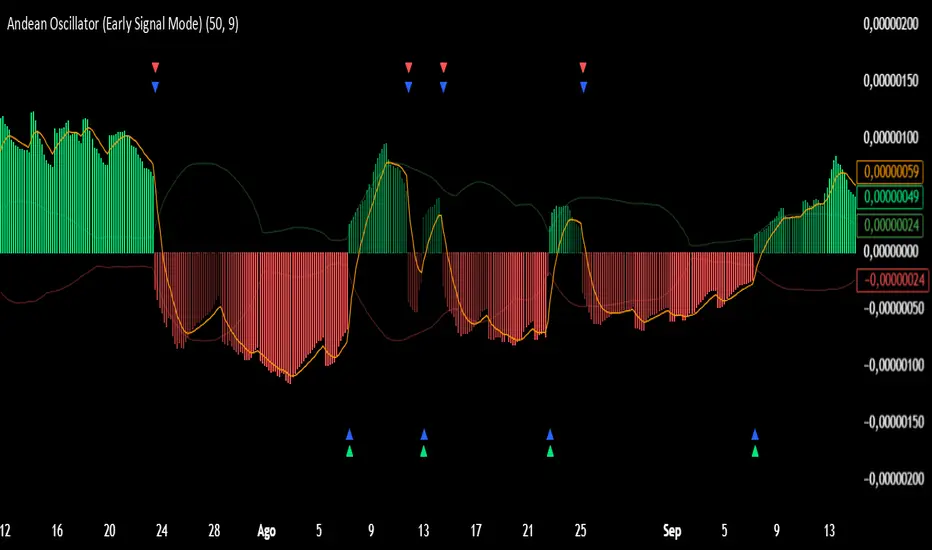
📊 What you see:
Histogram: Positive bars = bullish momentum, negative bars = bearish.
Orange Line: Signal line (EMA) used to confirm or anticipate reversals.
Zero Line: The equilibrium point. Crosses of this level signal a shift in market bias.
Green / Red Triangles: Buy and sell signals, either when crossing zero or crossing the signal line (depending on selected mode).
⚡ Early Signal Mode:
When enabled, signals trigger earlier — at the crossover between the oscillator and its signal line — allowing traders to enter potential reversals before a full zero-cross confirmation.
✅ Use cases:
Identify momentum shifts before price reversals.
Spot potential long/short setups with reduced lag.
Combine with price action or support/resistance for confirmation.
⚠️ Note: This is a tool for discretionary/manual trading. It does not open or close trades automatically. Always confirm with your own analysis and risk management.
This indicator is a momentum-based oscillator that measures the balance between bullish and bearish pressure.
🔧 How it works:
It calculates two adaptive envelopes around price and derives a "bullish" and "bearish" component.
The oscillator value is simply Bull - Bear, showing which side dominates.
A signal line (EMA of the oscillator) smooths the raw value.
Optionally, ±1σ levels are plotted to highlight statistically strong moves.
📊 What you see:
Histogram: Positive bars = bullish momentum, negative bars = bearish.
Orange Line: Signal line (EMA) used to confirm or anticipate reversals.
Zero Line: The equilibrium point. Crosses of this level signal a shift in market bias.
Green / Red Triangles: Buy and sell signals, either when crossing zero or crossing the signal line (depending on selected mode).
⚡ Early Signal Mode:
When enabled, signals trigger earlier — at the crossover between the oscillator and its signal line — allowing traders to enter potential reversals before a full zero-cross confirmation.
✅ Use cases:
Identify momentum shifts before price reversals.
Spot potential long/short setups with reduced lag.
Combine with price action or support/resistance for confirmation.
⚠️ Note: This is a tool for discretionary/manual trading. It does not open or close trades automatically. Always confirm with your own analysis and risk management.
סקריפט קוד פתוח
ברוח האמיתית של TradingView, יוצר הסקריפט הזה הפך אותו לקוד פתוח, כך שסוחרים יוכלו לעיין בו ולאמת את פעולתו. כל הכבוד למחבר! אמנם ניתן להשתמש בו בחינם, אך זכור כי פרסום חוזר של הקוד כפוף ל־כללי הבית שלנו.
כתב ויתור
המידע והפרסומים אינם מיועדים להיות, ואינם מהווים, ייעוץ או המלצה פיננסית, השקעתית, מסחרית או מכל סוג אחר המסופקת או מאושרת על ידי TradingView. קרא עוד ב־תנאי השימוש.