OPEN-SOURCE SCRIPT
Hull MA Multi-Time Frame 30 minutes

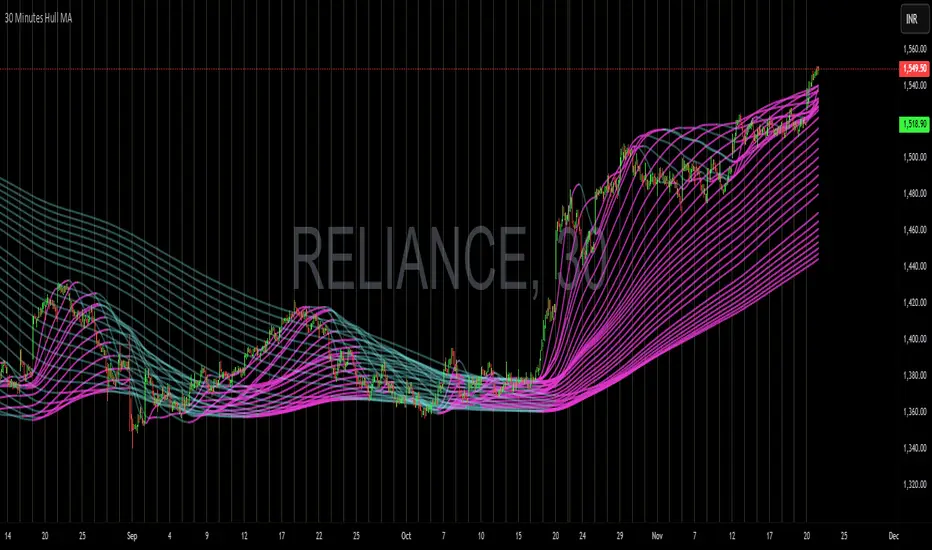
A Hull Moving Average (HMA) plotted on a fixed 30-minute timeframe gives a smooth, lag-free trend indication by filtering out noise.
When multiple HMAs of varying lengths converge near the lower side, it signals bullish accumulation, suggesting that sellers are exhausted and buyers are stepping in.
Conversely, when HMAs form a bouquet or cluster near the top, it indicates distribution or weakening momentum, signaling a potential bearish reversal.
In essence, HMA alignment and convergence act as a visual gauge of trend strength and turning points in market sentiment.
סקריפט קוד פתוח
ברוח האמיתית של TradingView, יוצר הסקריפט הזה הפך אותו לקוד פתוח, כך שסוחרים יוכלו לעיין בו ולאמת את פעולתו. כל הכבוד למחבר! אמנם ניתן להשתמש בו בחינם, אך זכור כי פרסום חוזר של הקוד כפוף ל־כללי הבית שלנו.
כתב ויתור
המידע והפרסומים אינם מיועדים להיות, ואינם מהווים, ייעוץ או המלצה פיננסית, השקעתית, מסחרית או מכל סוג אחר המסופקת או מאושרת על ידי TradingView. קרא עוד ב־תנאי השימוש.