PROTECTED SOURCE SCRIPT
Tweezer Pattern
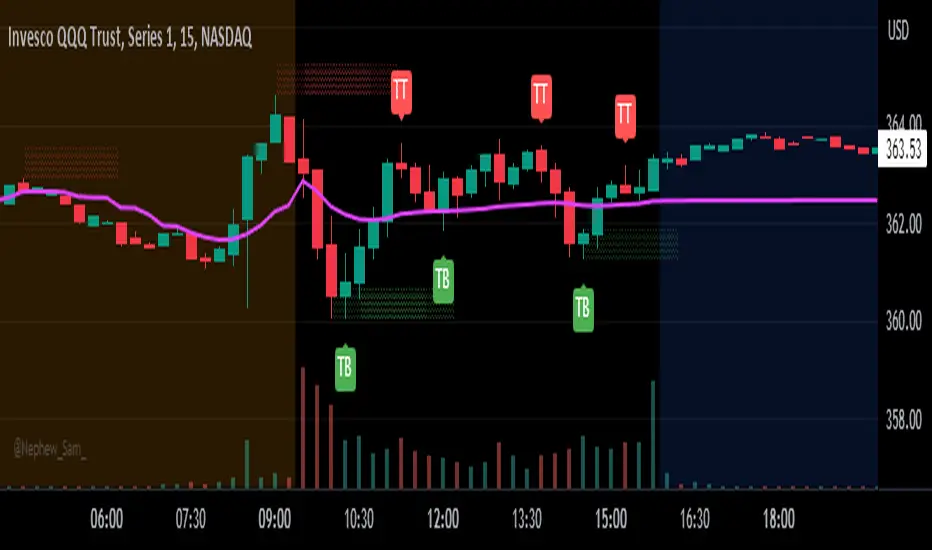
This is a rudimentary indicator to plot tweezer bottoms and tweezer tops. I use this primarily on the 15 minute, but may be applicable to other timeframes.
Criteria for a Tweezer Bottom:
- We were previously in a downtrend (determined by the color of the previous two candles)
- The current candle is green
- The current and previous candle have lower wicks
- The current candle open is approximately the same as the previous candle close (adjustable through settings)
Criteria for a Tweezer Top:
- We were previously in an uptrend (determined by the color of the previous two candles)
- The current candle is red
- The current and previous candle have upper wicks
- The current candle open is approximately the same as the previous candle close (adjustable through settings)
Potential Improvements:
- Determine trend through TA, for example using SMAs
- Ensure wick length as some percentage of candle height instead of just checking for existence
- Ensure tweezer candle is large or has some required minimum volume to reduce false positives
For any improvements or ideas, feel free to contact me :)
סקריפט מוגן
סקריפט זה פורסם כמקור סגור. עם זאת, תוכל להשתמש בו בחופשיות וללא כל מגבלות – למד עוד כאן
כתב ויתור
המידע והפרסומים אינם מיועדים להיות, ואינם מהווים, ייעוץ או המלצה פיננסית, השקעתית, מסחרית או מכל סוג אחר המסופקת או מאושרת על ידי TradingView. קרא עוד ב־תנאי השימוש.
סקריפט מוגן
סקריפט זה פורסם כמקור סגור. עם זאת, תוכל להשתמש בו בחופשיות וללא כל מגבלות – למד עוד כאן
כתב ויתור
המידע והפרסומים אינם מיועדים להיות, ואינם מהווים, ייעוץ או המלצה פיננסית, השקעתית, מסחרית או מכל סוג אחר המסופקת או מאושרת על ידי TradingView. קרא עוד ב־תנאי השימוש.