OPEN-SOURCE SCRIPT
Previous Day Close and Average VWAP value, Current Day 30 min HL
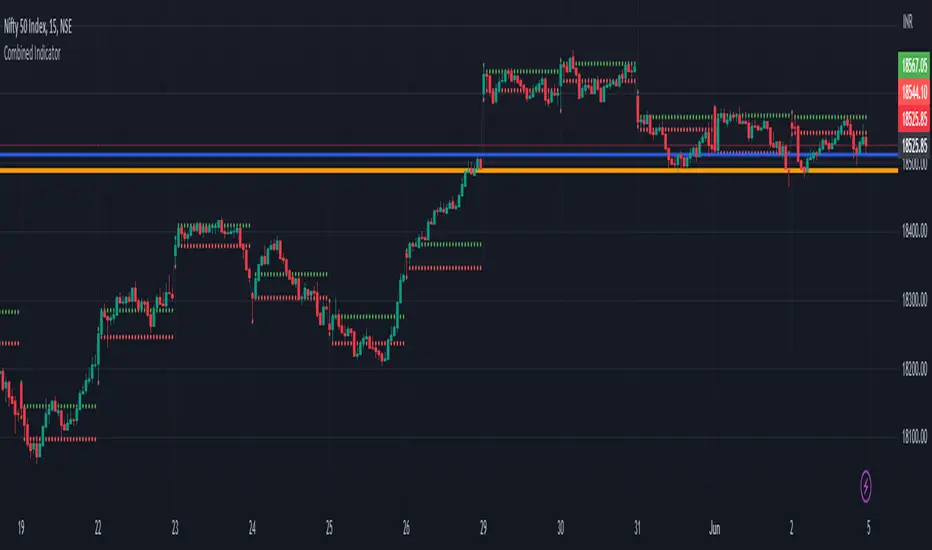
The code provided is a TradingView Pine Script that creates a combined indicator consisting of two separate components:
Indicator 1: Plot Lines with VWAP
This component plots lines on the chart using two different colors and widths.
It uses a custom function f_newLine to create a new line object with a specified color and width.
It uses another custom function f_moveLine to move a line to a specific location on the chart.
The line_close line is moved to a specific date and closing price.
The line_vwap line represents the VWAP (Volume Weighted Average Price) and is plotted using the line.new function.
The VWAP calculation is performed using the typical price (average of high, low, and close) and volume.
The VWAP is plotted on the chart using the plot function.
The previous day's VWAP is also plotted and connected to the current day's VWAP with a line.
Indicator 2: 30 Min high and low breakout
This component identifies a specific time range ("0915-0945") within each trading day.
It uses the ta.valuewhen function to find the highest and lowest prices during that time range.
The highest price is stored in the high_thirtymin variable, and the lowest price is stored in the low_thirtymin variable.
These prices are plotted on the chart as circles, with green representing the high and red representing the low.
The indicator combines these two components to provide visual information about the VWAP and the high/low breakout within a specific time range. The code also includes some additional logic to handle barstate and ensure correct calculations and plotting.
סקריפט קוד פתוח
ברוח האמיתית של TradingView, יוצר הסקריפט הזה הפך אותו לקוד פתוח, כך שסוחרים יוכלו לעיין בו ולאמת את פעולתו. כל הכבוד למחבר! אמנם ניתן להשתמש בו בחינם, אך זכור כי פרסום חוזר של הקוד כפוף ל־כללי הבית שלנו.
כתב ויתור
המידע והפרסומים אינם מיועדים להיות, ואינם מהווים, ייעוץ או המלצה פיננסית, השקעתית, מסחרית או מכל סוג אחר המסופקת או מאושרת על ידי TradingView. קרא עוד ב־תנאי השימוש.