PROTECTED SOURCE SCRIPT
EMAS Signal DX

Hello all,
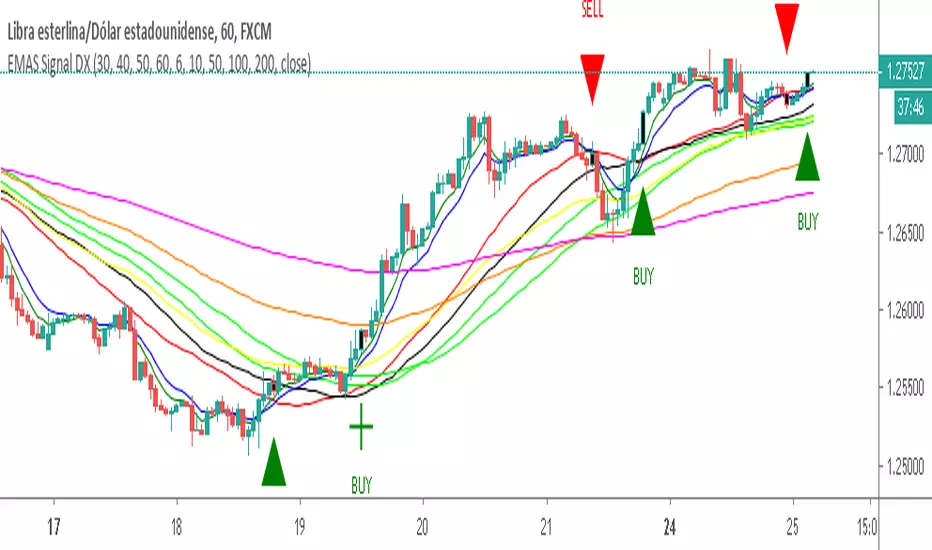
Vs2 of EMAS Signal Double Cross indicator that plots 5 EMA lines and 4 SMA .
Features:
-Signals are represented visually as a triangle on the chart.
-Also represented visually as bar color on the chart.
-When SMA and EMA 1 cross - a Long signal is called if SMA cross above EMA 1, a short if the cross is below EMA 1.
-When EMA 2 and EMA 3 cross - a Long signal is called if EMA 2 cross above EMA 3, a short if the cross is below EMA 3.
-You can activate and deactivate the triangles and the color of the bars.
That’s it, happy pips!
סקריפט מוגן
סקריפט זה פורסם כמקור סגור. עם זאת, תוכל להשתמש בו בחופשיות וללא כל מגבלות – למד עוד כאן
כתב ויתור
המידע והפרסומים אינם מיועדים להיות, ואינם מהווים, ייעוץ או המלצה פיננסית, השקעתית, מסחרית או מכל סוג אחר המסופקת או מאושרת על ידי TradingView. קרא עוד ב־תנאי השימוש.
סקריפט מוגן
סקריפט זה פורסם כמקור סגור. עם זאת, תוכל להשתמש בו בחופשיות וללא כל מגבלות – למד עוד כאן
כתב ויתור
המידע והפרסומים אינם מיועדים להיות, ואינם מהווים, ייעוץ או המלצה פיננסית, השקעתית, מסחרית או מכל סוג אחר המסופקת או מאושרת על ידי TradingView. קרא עוד ב־תנאי השימוש.