OPEN-SOURCE SCRIPT
מעודכן Easy-Read RSI (Signals & Zones)
This custom Pine Script reimagines the traditional RSI to make signals easier to see and act on. It smooths the RSI line using an EMA, adds a signal line (a moving average of the RSI), and colors the background for quick visual reference. Green shading marks oversold conditions, red shading marks overbought conditions, and a faint yellow band highlights the neutral zone (45–55). Together, these visual cues help you instantly recognize momentum shifts and potential reversals without staring at raw numbers.
The script also plots bullish and bearish signal arrows: upward arrows appear when RSI crosses above its signal line or exits the oversold zone, while downward arrows mark when RSI crosses below its signal or falls from the overbought zone. It includes built-in TradingView alerts for each event, so you can receive notifications of key turning points automatically.
Quick-Read Guide for Easy-Read RSI
Green background: RSI is in the oversold zone (typically below 30). The market may be near a short-term bottom. Watch for an up arrow (OS↑) — this suggests a possible bullish reversal or entry point.
Red background: RSI is in the overbought zone (typically above 70). The market may be overextended to the upside. Watch for a down arrow (OB↓) — this can signal a bearish reversal or exit opportunity.
Yellow background: RSI is in the neutral zone (roughly between 45 and 55). This usually means the market is consolidating or lacks a clear direction. Signals in this area are weaker and often less reliable.
Up arrow (RSI↑MA): RSI crosses above its signal line — a sign of strengthening bullish momentum or trend continuation. Can be used as a buy or add signal when confirmed by price action.
Down arrow (RSI↓MA): RSI crosses below its signal line — a sign of weakening momentum or potential reversal to the downside. Can be used as a sell or reduce-exposure signal.
OS↑ arrow: RSI moves up out of the oversold zone. This indicates early recovery momentum and potential reversal from a dip.
OB↓ arrow: RSI moves down out of the overbought zone. This signals momentum cooling and possible reversal from a high.
הערות שחרור
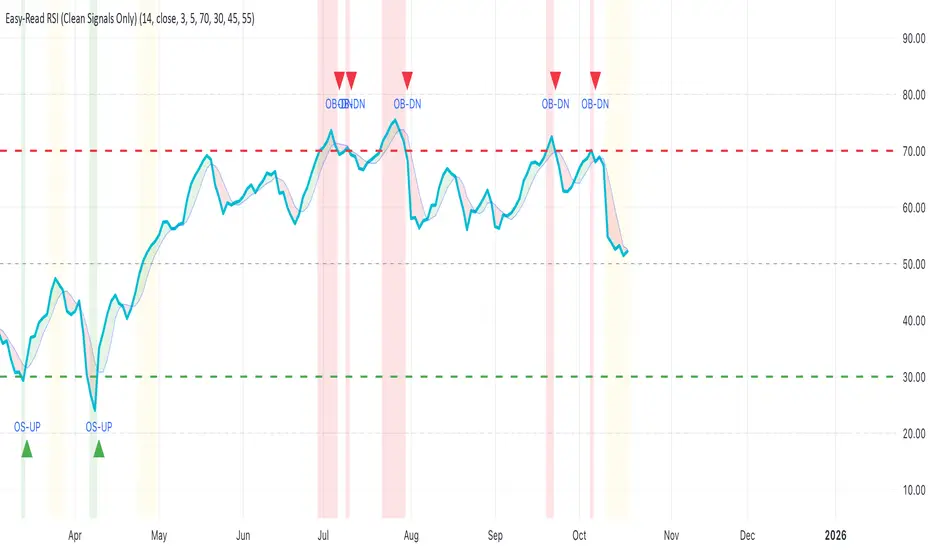
An easy-to-read RSI (Relative Strength Index) indicator that highlights market momentum and potential turning points using simple colors and visual signals. It smooths the RSI line slightly with an EMA and adds a signal line for reference, then clearly marks the key RSI zones: red background when the market is overbought (RSI ≥ 70), green background when oversold (RSI ≤ 30), and yellow background when the RSI is neutral (around 45–55). This helps traders quickly see whether momentum is strong, weak, or balanced without needing to interpret small RSI movements.In addition to background colors, the indicator plots two key signals on the RSI panel:
A green triangle labeled “OS-UP” appears when RSI crosses up out of the oversold zone (suggesting potential upward momentum or recovery).
A red triangle labeled “OB-DN” appears when RSI crosses down out of the overbought zone (warning of possible downward momentum or correction).
These visual cues make it easier to identify momentum shifts at a glance. The script also includes alerts for both events, so traders can receive notifications when RSI leaves overbought or oversold conditions — making it a clean, minimal, and practical RSI tool for both quick reading and alert-based trading.
סקריפט קוד פתוח
ברוח TradingView אמיתית, היוצר של הסקריפט הזה הפך אותו לקוד פתוח, כך שסוחרים יכולים לבדוק ולאמת את הפונקציונליות שלו. כל הכבוד למחבר! למרות שאתה יכול להשתמש בו בחינם, זכור שפרסום מחדש של הקוד כפוף לכללי הבית שלנו.
כתב ויתור
המידע והפרסומים אינם אמורים להיות, ואינם מהווים, עצות פיננסיות, השקעות, מסחר או סוגים אחרים של עצות או המלצות שסופקו או מאושרים על ידי TradingView. קרא עוד בתנאים וההגבלות.