DepthHouse - Peak Divergence
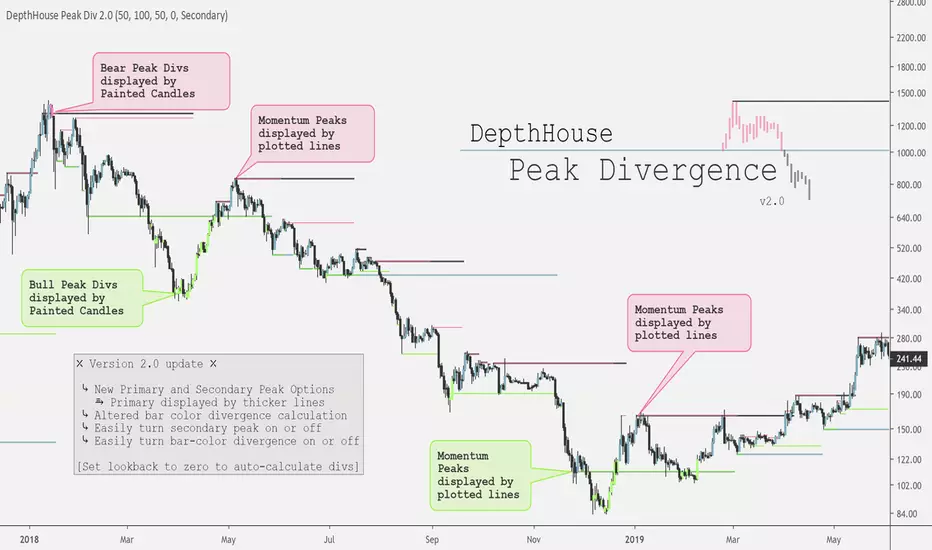
These peak levels are then plotted by either red or green lines above or below the candle.
Red lines represent a peak in bear momentum while green represents peaks in bull momentum.
These levels are then used to determine momentum divergence in the displayed market.
If divergence is present the bars colors will change represent either bull or bear div.
Important Notes:
If the price crosses a peak line and the bar color does not change; it means momentum has increased/decreased with the price and the divergence has been canceled.
If divergence is present, and then the following candle is not colored then momentum has increased to cancel the previously present divergence.
By default, the look-back period is set to zero, which automatically calculates the distance for the peak levels to look-back. However this number can be set to whatever look-back period you would like.
At time of release this indicator is in its early stages. So please leave feedback on how it can be improved!
⤷ New Primary and Secondary Peak Options
⥱ Primary displayed by thicker lines
⥱ Secondary displayed by thinner lines
⤷ Altered bar color divergence calculation
⤷ Easily turn secondary peak on or off
⤷ Easily turn bar-color divergence on or off
סקריפט להזמנה בלבד
רק משתמשים שאושרו על ידי המחבר יכולים לגשת לסקריפט הזה. יהיה עליך לשלוח בקשת גישה ולקבל אישור לשימוש. בדרך כלל, הגישה ניתנת לאחר תשלום. למידע נוסף, עקוב אחר ההוראות של היוצר בהמשך או צור קשר עם oh92 ישירות.
TradingView לא ממליצה לשלם עבור סקריפט או להשתמש בו אלא אם כן אתה סומך לחלוטין על המחבר שלו ומבין כיצד הוא פועל. ייתכן שתוכל גם למצוא חלופות חינמיות וקוד פתוח ב-סקריפטים הקהילתיים שלנו.
הוראות המחבר
↣ depthhouse.com/
כתב ויתור
סקריפט להזמנה בלבד
רק משתמשים שאושרו על ידי המחבר יכולים לגשת לסקריפט הזה. יהיה עליך לשלוח בקשת גישה ולקבל אישור לשימוש. בדרך כלל, הגישה ניתנת לאחר תשלום. למידע נוסף, עקוב אחר ההוראות של היוצר בהמשך או צור קשר עם oh92 ישירות.
TradingView לא ממליצה לשלם עבור סקריפט או להשתמש בו אלא אם כן אתה סומך לחלוטין על המחבר שלו ומבין כיצד הוא פועל. ייתכן שתוכל גם למצוא חלופות חינמיות וקוד פתוח ב-סקריפטים הקהילתיים שלנו.
הוראות המחבר
↣ depthhouse.com/