OPEN-SOURCE SCRIPT
Realized volatility differential
About
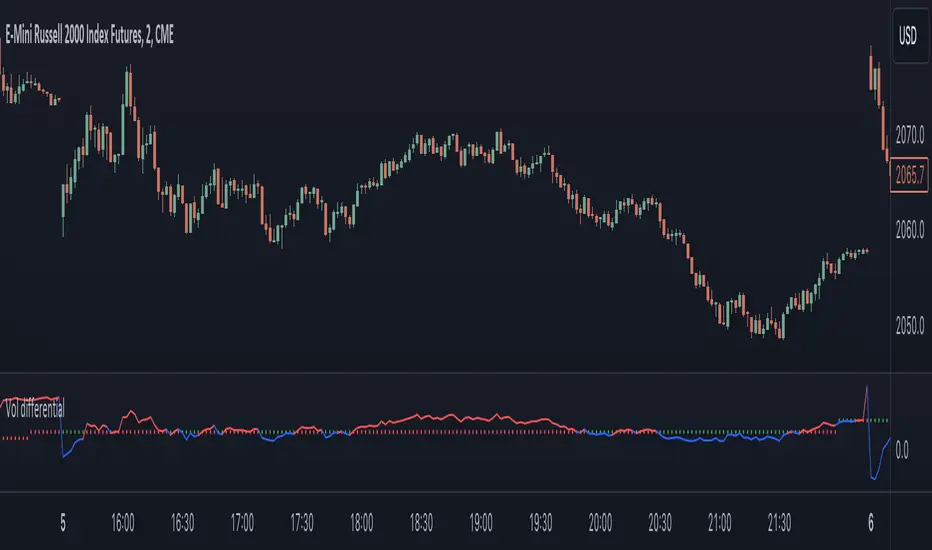
This is a simple indicator that takes into account two types of realized volatility: Close-Close and High-Low (the latter is more useful for intraday trading).
The output of the indicator is two values / plots:
When the current value is:
How to use it
It might be used as a timing tool for mean reversion strategies = when your primary strategy says a market is in mean reversion mode, you could use it as a signal for opening a position.
For example: let's say a security is in uptrend and approaching an important level (important to you).
If the current value is:
Intended securities
Futures contracts
This is a simple indicator that takes into account two types of realized volatility: Close-Close and High-Low (the latter is more useful for intraday trading).
The output of the indicator is two values / plots:
- an average of High-Low volatility minus Close-Close volatility (10day period is used as a default)
- the current value of the indicator
When the current value is:
- lower / below the average, then it means that High-Low volatility should increase.
- higher / above then obviously the opposite is true.
How to use it
It might be used as a timing tool for mean reversion strategies = when your primary strategy says a market is in mean reversion mode, you could use it as a signal for opening a position.
For example: let's say a security is in uptrend and approaching an important level (important to you).
If the current value is:
- above the average, a short position can be opened, as High-Low volatility should decrease;
- below the average, a trend should continue.
Intended securities
Futures contracts
סקריפט קוד פתוח
ברוח האמיתית של TradingView, יוצר הסקריפט הזה הפך אותו לקוד פתוח, כך שסוחרים יוכלו לעיין בו ולאמת את פעולתו. כל הכבוד למחבר! אמנם ניתן להשתמש בו בחינם, אך זכור כי פרסום חוזר של הקוד כפוף ל־כללי הבית שלנו.
כתב ויתור
המידע והפרסומים אינם מיועדים להיות, ואינם מהווים, ייעוץ או המלצה פיננסית, השקעתית, מסחרית או מכל סוג אחר המסופקת או מאושרת על ידי TradingView. קרא עוד ב־תנאי השימוש.