OPEN-SOURCE SCRIPT
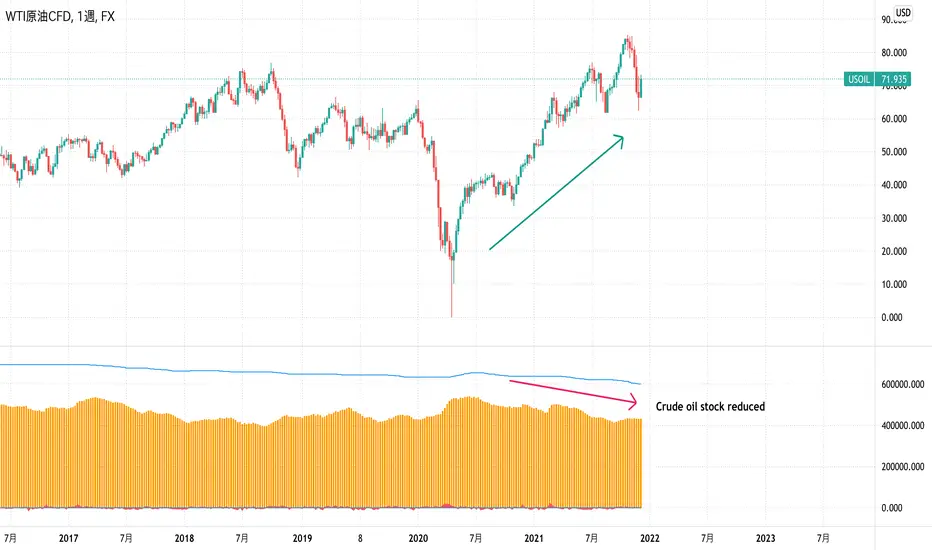
EIA Crude Oil Stock Statistics

Japanese below / 日本語説明は下記
Dear Oil Traders/Investors,
I have created this indicator which shows EIA crude oil stock statistics provided by EIA(U.S. Energy Information Administration).
Like other commodities, oil prices are highly affected by demand and supply and increase/decrease of crude oil stock cause crude oil price fluctuation.
This indicator is created to help oil traders/investors easily analyze crude oil statistics along with price movement.
It displays the following data as per data released by EIA on weekly basis. (Data source is quandle.com)
-Crude Oil Ending Stock
-Crude Oil SPR Ending Stock
-Stock changes from previous week(Calculated by the indicator)
-% changes(Calculated by the indicator)
Enjoy!
============================
原油トレーダー/投資家の皆さん
EIA(米エネルギー省エネルギー情報局)が公表している原油在庫統計をサブウィンドウに表示するインジケーターを開発しました。
他のコモディティと同様に、原油価格は需要と供給に大きく影響を受けます。
特に原油在庫の増減は原油価格を変動させる要因の一つです。
このインジケーターは原油トレーダー/投資家が原油在庫統計を価格の動きとともに容易に分析できることを目的としています。
EIAから週単位で公開されるデータのうち、以下のデータを表示します。(データソースはquandle.comです。)
-原油在庫
-SPR在庫
-原油在庫変動数(対前週比)
-原油在庫変動率(%)(対前週比)
סקריפט קוד פתוח
ברוח האמיתית של TradingView, יוצר הסקריפט הזה הפך אותו לקוד פתוח, כך שסוחרים יוכלו לעיין בו ולאמת את פעולתו. כל הכבוד למחבר! אמנם ניתן להשתמש בו בחינם, אך זכור כי פרסום חוזר של הקוד כפוף ל־כללי הבית שלנו.
■”なぜ”がわかる相場分析
・チャートの動きというファクトを元に
・客観的かつロジカルに
・初心者でもわかるように
相場展望を解説
Followすると投稿の度に通知が届きます。
bit.ly/3s888QI
■Editor's Pick
bit.ly/3pkLCEl
■Blog
bit.ly/2VPAMJk
■Indicator
bit.ly/3lmWYFk
■Membership
bit.ly/3zvLkPG
・チャートの動きというファクトを元に
・客観的かつロジカルに
・初心者でもわかるように
相場展望を解説
Followすると投稿の度に通知が届きます。
bit.ly/3s888QI
■Editor's Pick
bit.ly/3pkLCEl
■Blog
bit.ly/2VPAMJk
■Indicator
bit.ly/3lmWYFk
■Membership
bit.ly/3zvLkPG
כתב ויתור
המידע והפרסומים אינם מיועדים להיות, ואינם מהווים, ייעוץ או המלצה פיננסית, השקעתית, מסחרית או מכל סוג אחר המסופקת או מאושרת על ידי TradingView. קרא עוד ב־תנאי השימוש.