OPEN-SOURCE SCRIPT
מעודכן Low-High RSI

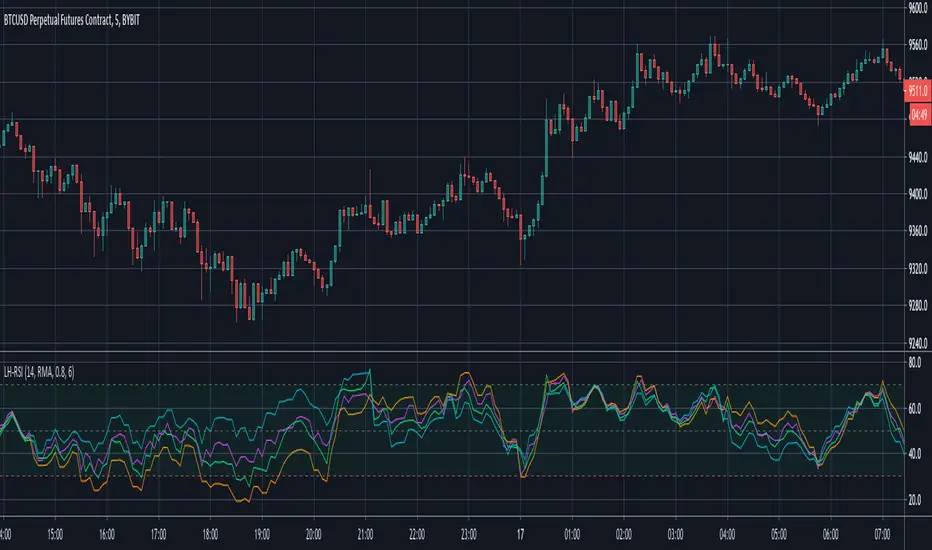
It is an RSI indicator with 3 lines (or 4 if you enable the original RSI in settings):
You can also select different moving averages for RSI calculation. (The default is the original RMA)
This indicator is useful for e.g. to filter out original RSI's false signals by waiting both low and high lines to confirm. Or you can use it as an earlier exit indicator.
Please write a comment if you find another usage of it.
- The lime is calculated from high
- The fuchsia is calculated from low
- The orange one is calcuated form both high and low, by calculating RSI's up from high and down from low
You can also select different moving averages for RSI calculation. (The default is the original RMA)
This indicator is useful for e.g. to filter out original RSI's false signals by waiting both low and high lines to confirm. Or you can use it as an earlier exit indicator.
Please write a comment if you find another usage of it.
הערות שחרור
Added RSI HL to the linesסקריפט קוד פתוח
ברוח האמיתית של TradingView, יוצר הסקריפט הזה הפך אותו לקוד פתוח, כך שסוחרים יוכלו לעיין בו ולאמת את פעולתו. כל הכבוד למחבר! אמנם ניתן להשתמש בו בחינם, אך זכור כי פרסום חוזר של הקוד כפוף ל־כללי הבית שלנו.
כתב ויתור
המידע והפרסומים אינם מיועדים להיות, ואינם מהווים, ייעוץ או המלצה פיננסית, השקעתית, מסחרית או מכל סוג אחר המסופקת או מאושרת על ידי TradingView. קרא עוד ב־תנאי השימוש.
סקריפט קוד פתוח
ברוח האמיתית של TradingView, יוצר הסקריפט הזה הפך אותו לקוד פתוח, כך שסוחרים יוכלו לעיין בו ולאמת את פעולתו. כל הכבוד למחבר! אמנם ניתן להשתמש בו בחינם, אך זכור כי פרסום חוזר של הקוד כפוף ל־כללי הבית שלנו.
כתב ויתור
המידע והפרסומים אינם מיועדים להיות, ואינם מהווים, ייעוץ או המלצה פיננסית, השקעתית, מסחרית או מכל סוג אחר המסופקת או מאושרת על ידי TradingView. קרא עוד ב־תנאי השימוש.