OPEN-SOURCE SCRIPT
Entry points
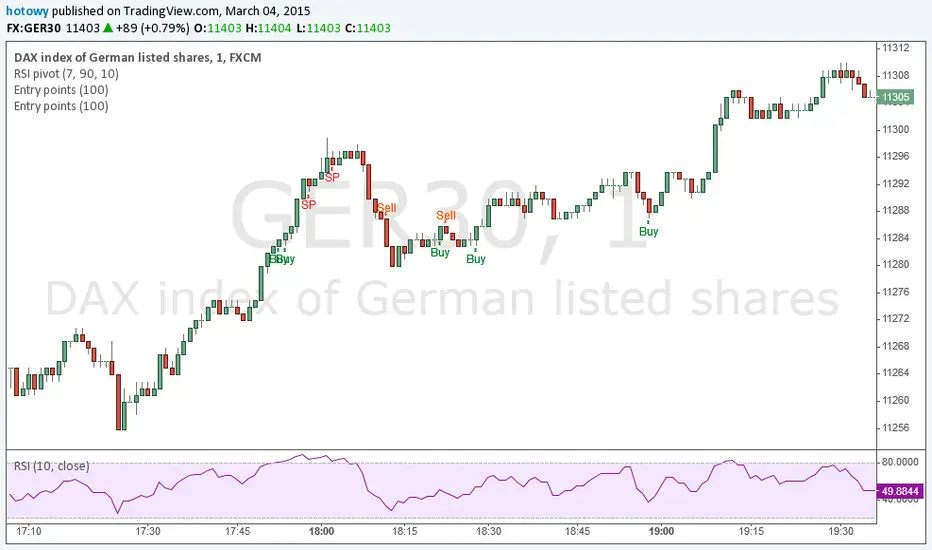
This great and simple indicator based on EMA generates information about entry points at close of the candle. First signal is the best entry point but you can re-enter at the next. IMPORTANT: this script does not generate exit signals and those shoud be find using money management rules or else. Perfectly catches long runs in trends at all underlayings (forex, stocks, indexes, commodities) at all timeframes. Period=100 works best independently on timeframe but I encourage you to try other. Lower period gives more incorrect signals and shorter runs, higher period gives you late entry and less. Ofcourse it gives false signals from time to time but fortunately it makes a correction very fast. Try it! Good luck and good traiding!
סקריפט קוד פתוח
ברוח האמיתית של TradingView, יוצר הסקריפט הזה הפך אותו לקוד פתוח, כך שסוחרים יוכלו לעיין בו ולאמת את פעולתו. כל הכבוד למחבר! אמנם ניתן להשתמש בו בחינם, אך זכור כי פרסום חוזר של הקוד כפוף ל־כללי הבית שלנו.
כתב ויתור
המידע והפרסומים אינם מיועדים להיות, ואינם מהווים, ייעוץ או המלצה פיננסית, השקעתית, מסחרית או מכל סוג אחר המסופקת או מאושרת על ידי TradingView. קרא עוד ב־תנאי השימוש.