PROTECTED SOURCE SCRIPT
מעודכן Earnings line & P/E Tracker
# Earnings line & P/E Tracker
**A comprehensive fundamental analysis indicator that overlays earnings data and P/E ratios directly on your price charts.**
## 📊 Key Features
### Automatic Data Retrieval
- **Real-time financial data** pulled directly from TradingView's financial database
- **Multiple data sources**: Earnings Per Share (Basic/Diluted), Total Revenue, Net Income
- **Flexible periods**: TTM (Trailing Twelve Months), FQ (Quarterly), FY (Annual)
- **Live P/E ratio calculation** based on current price and TTM earnings
### Visual Display Options
- **Earnings progression line** overlaid on price chart for easy comparison
- **P/E ratio plot** with distinctive circle markers
- **Comprehensive data table** showing all key metrics in real-time
- **Dark mode optimized** with high-contrast colors for excellent readability
### Optional Event Tracking
- **Custom earnings dates** input for upcoming releases
- **Visual markers** on earnings announcement dates
- **Background highlighting** during earnings weeks
- **Smart alerts** for significant P/E changes and data updates
## 🎯 Perfect For
- **Fundamental analysts** comparing earnings growth vs stock price movement
- **Value investors** tracking P/E ratios and earnings trends
- **Earnings season trading** with visual release date markers
- **Long-term investors** monitoring fundamental health alongside technical analysis
## ⚙️ Customization Options
### Data Selection
- Choose between EPS Basic, EPS Diluted, Total Revenue, or Net Income
- Select TTM, quarterly, or annual reporting periods
- Toggle individual display elements on/off
### Visual Styling
- Customizable colors for earnings line, P/E ratio, and event markers
- Adjustable line width and styling options
- Moveable data table with size and position controls
### Event Management
- Input custom earnings release dates
- Enable/disable earnings event markers
- Background highlighting for earnings periods
- Configurable alert thresholds
## 📈 How It Works
1. **Automatic Detection**: The indicator automatically detects available fundamental data for your selected symbol
2. **Real-time Updates**: Financial metrics update as new data becomes available
3. **Visual Integration**: Earnings data is scaled and overlaid directly on your price chart
4. **Status Monitoring**: Clear indicators show data availability and freshness
## 🔧 Setup Instructions
1. Add the indicator to your chart
2. Select your preferred data source (EPS recommended for P/E tracking)
3. Choose time period (TTM recommended for most analyses)
4. Customize colors and display options to your preference
5. Optionally add upcoming earnings dates for event tracking
## 💡 Pro Tips
- **Use TTM EPS** for the most accurate P/E ratio calculations
- **Compare earnings line slope** with price movement to spot divergences
- **Enable earnings events** to prepare for volatility around announcements
- **Works best on daily/weekly timeframes** for fundamental analysis
## ⚠️ Data Availability
- Requires stocks with available fundamental data in TradingView's database
- Most major US stocks, ETFs, and international equities supported
- Limited data may be available for small-cap or recently listed companies
- Clear "No Data" indicator when fundamental data is unavailable
## 🎨 Display Features
- **High contrast colors** optimized for both light and dark chart themes
- **Clean, professional table** displaying all key metrics
- **Intuitive visual markers** for earnings events and data points
- **Responsive design** that adapts to different chart sizes
---
**Perfect for traders and investors who want to combine fundamental analysis with technical charting in a single, comprehensive view.**
## ⚠️ Important Disclaimer
**This indicator is provided for educational and informational purposes only. The author (raptor2030) is not responsible for:**
- **Data accuracy or completeness** - Financial data is sourced from TradingView's database and may contain errors, delays, or omissions
- **Trading decisions** - This tool should not be used as the sole basis for investment decisions
- **Financial losses** - Past performance does not guarantee future results
- **Data reliability** - Third-party data sources may experience outages or provide incorrect information
- **Market timing** - Earnings dates and projections may be inaccurate or outdated
**Always verify critical information from official company sources and consult with qualified financial professionals before making investment decisions.**
**Use this indicator at your own risk. The author disclaims all liability for any direct, indirect, or consequential damages arising from the use of this script.**
הערות שחרור
Bug fixesהערות שחרור
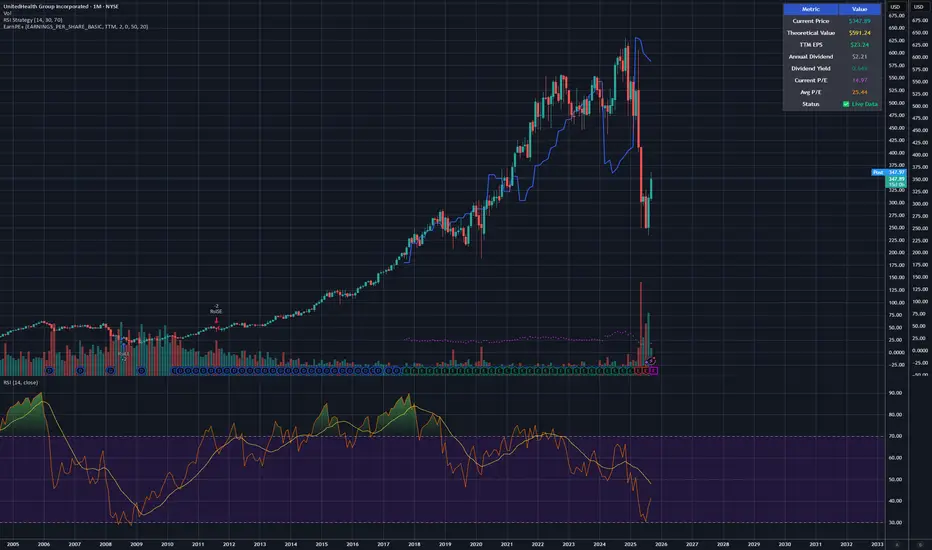
Enhanced Earnings & P/E Tracker v1.2 - Technical DescriptionA comprehensive fundamental analysis indicator for TradingView that combines real-time earnings data, P/E ratios, and dividend information in a single integrated tool.
Core Features
Theoretical Value Calculation:
- []Calculates stock's theoretical fair value using the formula: []Blue line displays this theoretical value for direct comparison with market price
Pine Script® TTM EPS × Average P/E - Average P/E automatically calculated over configurable period (default: 50 bars) or manual P/E input option
Automatic Dividend Retrieval:
- []Utilizes to fetch real dividend data from TradingView's database
Pine Script® request.dividends()
[]Fallback system to manual input when automatic data unavailable - Real-time dividend yield calculation:
Pine Script® (Annual Dividend ÷ Current Price) × 100
Comprehensive Analysis Table:
- []Current price vs theoretical value (identifies over/undervaluation)
[]TTM EPS (Trailing Twelve Months Earnings Per Share)
[]Annual dividend amount and yield percentage
[]Current P/E vs historical average P/E - Data status indicator (real-time availability)
Version 1.2 Improvements
Blue Line (Theoretical Value) Corrections:
- [][]Resolved display issues with more realistic P/E parameters
Pine Script® Fixed calculation to display actual fundamental value based on earnings - Enhanced visibility and accuracy of fair value representation
Dividend System Implementation:
- []Proper implementation of with correct parameters
Pine Script® request.dividends()
[]Eliminated runtime errors through hybrid automatic/manual system - Seamless integration of real dividend data when available
Technical Stability:
- []Removed all undeclared variables causing compilation errors
[]Native Pine Script v6 syntax without deprecated dependencies - Streamlined code structure for optimal performance
Practical Applications
The indicator enables quick identification of:
- []Potentially undervalued stocks (price below blue line)
[]Potentially overvalued stocks (price above blue line)
[]Real-time dividend yields for income-focused strategies
[]P/E ratio evolution compared to historical averages
Particularly valuable for value investing analysis following Benjamin Graham principles, providing integrated fundamental evaluation directly within technical chart analysis.
Interface Features
Dark background with white text for optimal readability in dark mode. Color-coded metrics with repositionable table display for customized workspace integration.
סקריפט מוגן
סקריפט זה פורסם כמקור סגור. עם זאת, תוכל להשתמש בו בחופשיות וללא כל מגבלות – למד עוד כאן
כתב ויתור
המידע והפרסומים אינם מיועדים להיות, ואינם מהווים, ייעוץ או המלצה פיננסית, השקעתית, מסחרית או מכל סוג אחר המסופקת או מאושרת על ידי TradingView. קרא עוד ב־תנאי השימוש.
סקריפט מוגן
סקריפט זה פורסם כמקור סגור. עם זאת, תוכל להשתמש בו בחופשיות וללא כל מגבלות – למד עוד כאן
כתב ויתור
המידע והפרסומים אינם מיועדים להיות, ואינם מהווים, ייעוץ או המלצה פיננסית, השקעתית, מסחרית או מכל סוג אחר המסופקת או מאושרת על ידי TradingView. קרא עוד ב־תנאי השימוש.