OPEN-SOURCE SCRIPT
Chart Patterns Buy Alerts (Intraday) - Bullish Patterns
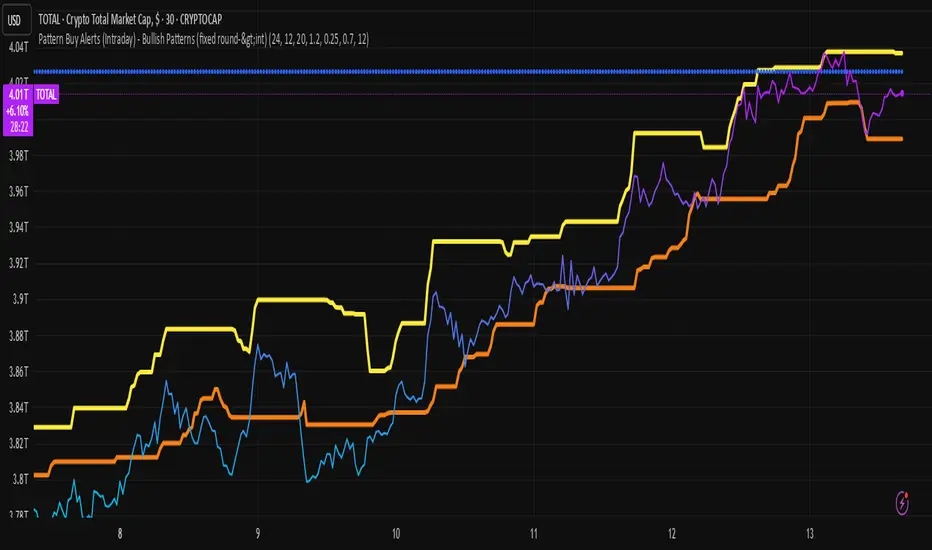
chart pattern prediction
The script plots two things:
predicted_direction → +1 (up) or -1 (down).
predicted_value → the next bar’s estimated close price.
So on your chart you’ll see:
Blue histogram → shows up (+1) or down (-1) prediction.
Orange line → predicted next value.
Interpret the Output
If the blue bar is +1, the model expects the next candle to close higher.
If the blue bar is -1, the model expects the next candle to close lower.
The orange line shows where it thinks the next close will land.
סקריפט קוד פתוח
ברוח האמיתית של TradingView, יוצר הסקריפט הזה הפך אותו לקוד פתוח, כך שסוחרים יוכלו לעיין בו ולאמת את פעולתו. כל הכבוד למחבר! אמנם ניתן להשתמש בו בחינם, אך זכור כי פרסום חוזר של הקוד כפוף ל־כללי הבית שלנו.
כתב ויתור
המידע והפרסומים אינם מיועדים להיות, ואינם מהווים, ייעוץ או המלצה פיננסית, השקעתית, מסחרית או מכל סוג אחר המסופקת או מאושרת על ידי TradingView. קרא עוד ב־תנאי השימוש.