PROTECTED SOURCE SCRIPT
BullBarbie's Automagical Psych Levels v1.1

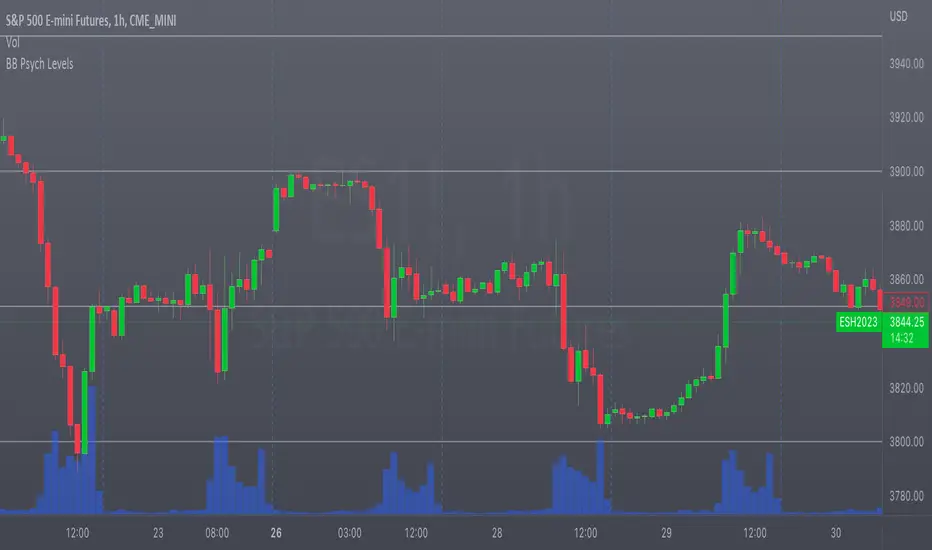
This indicator does one thing (and it does it extremely well)...
Automatically plot levels at a set a set interval in a set range to create psychological levels on your chart.
There are 3 Options:
1) The price range in which you'd like to plot these level lines
2) The interval (price range) between the levels
3) The color/style you'd like the line to by
No nonsense, just KISS: Keep It Simple, Silly.
I created this script to easily add psychological (psych) levels to my most watched charts, especially the Indexes such as SPX, SPY, QQQ... I hope you enjoy it.
סקריפט מוגן
סקריפט זה פורסם כמקור סגור. עם זאת, תוכל להשתמש בו בחופשיות וללא כל מגבלות – למד עוד כאן
כתב ויתור
המידע והפרסומים אינם מיועדים להיות, ואינם מהווים, ייעוץ או המלצה פיננסית, השקעתית, מסחרית או מכל סוג אחר המסופקת או מאושרת על ידי TradingView. קרא עוד ב־תנאי השימוש.
סקריפט מוגן
סקריפט זה פורסם כמקור סגור. עם זאת, תוכל להשתמש בו בחופשיות וללא כל מגבלות – למד עוד כאן
כתב ויתור
המידע והפרסומים אינם מיועדים להיות, ואינם מהווים, ייעוץ או המלצה פיננסית, השקעתית, מסחרית או מכל סוג אחר המסופקת או מאושרת על ידי TradingView. קרא עוד ב־תנאי השימוש.