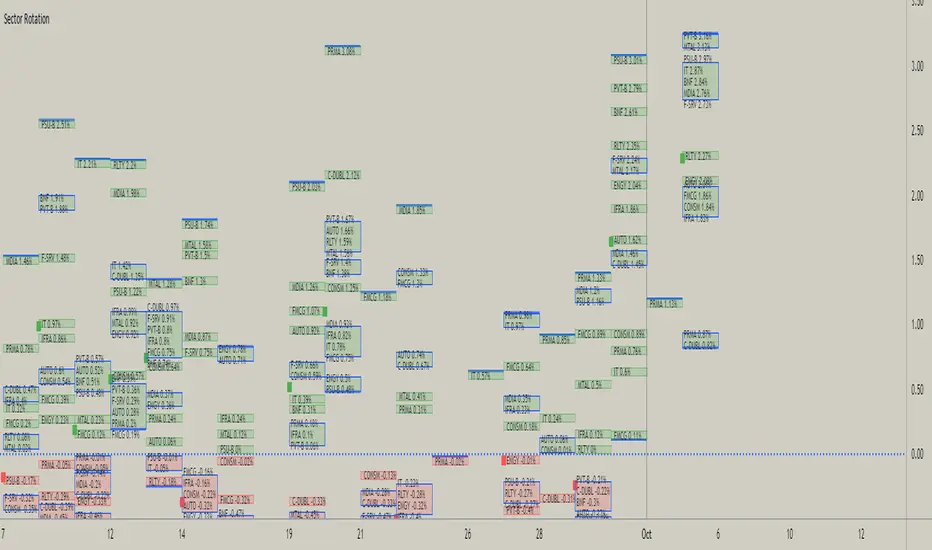
This script is attempt to create and observe the real-time and historical performance of the all major sectors of Indian Market in one screen.
for Data Presentation I used Short sector names so that I can manage to get space and efficient presentable data.
Short Names and Actual Sector Names

In this Update following features are added
for Data Presentation I used Short sector names so that I can manage to get space and efficient presentable data.
Short Names and Actual Sector Names
- BNF : CNX-BANKNIFTY
- IT : CNX-IT
- PRMA : CNX - PHARMA
- FMCG : CNX-FMCG
- AUTO : CNX-AUTO
- MTAL : CNX-METAL
- MDIA : CNX-MEDIA
- RLTY : CNX-REALTY
- IFRA : CNX-INFRA
- ENGY : CNX-ENERGY
- PSU-B : CNX-PSU-BANK
- PVT-B : NIFTY-PVT-BANK
- F-SRV : CNX-FINANCE
- CONSM : CNX-CONSUMPTION
- C-DUBL : NIFTY_CONSR_DURBL
- You can use this script in 30-min, Daily, Weekly and Monthly Time Frames.
- The green Square denotes the current Symbol Performance.
- The Blue Border boxes are created when one sector intersects other sector.
In this Update following features are added
- Now users have control over sectors, what are all the sectors you wanted to plot you can select from the input menu.
- Currently user can highlight any one sector in different border color so that user can easily spot and track particular sector.
- This thicker blue line denotes lowest and highest point of the current timeframe.
סקריפט קוד פתוח
ברוח האמיתית של TradingView, יוצר הסקריפט הזה הפך אותו לקוד פתוח, כך שסוחרים יוכלו לעיין בו ולאמת את פעולתו. כל הכבוד למחבר! אמנם ניתן להשתמש בו בחינם, אך זכור כי פרסום חוזר של הקוד כפוף ל־כללי הבית שלנו.
כתב ויתור
המידע והפרסומים אינם מיועדים להיות, ואינם מהווים, ייעוץ או המלצה פיננסית, השקעתית, מסחרית או מכל סוג אחר המסופקת או מאושרת על ידי TradingView. קרא עוד ב־תנאי השימוש.
