OPEN-SOURCE SCRIPT
מעודכן CoG SSL BF 🚀

In this strategy I combine my Center of Gravity script with my SSL Channel script.
The conditions for a long signal are if either:
Center of Gravity long is satisfied
Or
SSL Channel long is satisfied AND we are not in a sideways period.
The conditions for a short signal are if either:
Center of Gravity short is satisfied
Or
SSL Channel short is satisfied AND we are not in a sideways period.
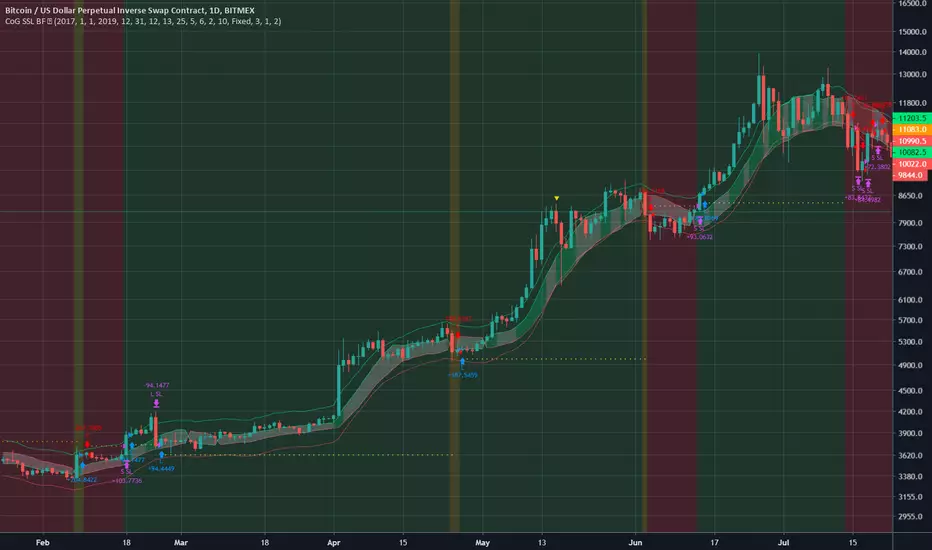
We use a dynamic stop loss based on ATR to determine optimum stop loss levels. These levels are printed on the chart in yellow and orange.
INSTRUCTIONS
On the chart, the 2 outer lines are the Center of Gravity lines and the filled channel in the middle is the SSL channel.
If the channel is white, this is a no trade zone, unless either Center of Gravity long/short signal is satisfied.
If we get stopped out from a long and we still have a long condition present, we re-enter. Same for short.
The conditions for a long signal are if either:
Center of Gravity long is satisfied
Or
SSL Channel long is satisfied AND we are not in a sideways period.
The conditions for a short signal are if either:
Center of Gravity short is satisfied
Or
SSL Channel short is satisfied AND we are not in a sideways period.
We use a dynamic stop loss based on ATR to determine optimum stop loss levels. These levels are printed on the chart in yellow and orange.
INSTRUCTIONS
- Bright green background = go long
- Bright red background = go short
- Yellow dotted line = long stop loss
- Orange dotted line = short stop loss
On the chart, the 2 outer lines are the Center of Gravity lines and the filled channel in the middle is the SSL channel.
If the channel is white, this is a no trade zone, unless either Center of Gravity long/short signal is satisfied.
If we get stopped out from a long and we still have a long condition present, we re-enter. Same for short.
הערות שחרור
Added an option to switch between a fixed stop loss and ATR derived stop loss. Both have their pros and cons so now you can choose! The yellow and orange lines will still represent the stop loss placement for either choice.הערות שחרור
Because of the OR conditions in the long and short signal generation, it is possible to have both a short and long signal on the same candle. I have changed the background color to yellow to show this. When this happens, whatever trade direction we are currently in, we exit and enter the opposite since it is considered an opposing signal despite the existing signal in the same direction still being there. Example: we are long and get a yellow background, that means there are conditions that satisfy a short signal and a long signal but since we are long we exit and swap to short. Thanks go to LuckyZenyatta for pointing this out.סקריפט קוד פתוח
ברוח האמיתית של TradingView, יוצר הסקריפט הזה הפך אותו לקוד פתוח, כך שסוחרים יוכלו לעיין בו ולאמת את פעולתו. כל הכבוד למחבר! אמנם ניתן להשתמש בו בחינם, אך זכור כי פרסום חוזר של הקוד כפוף ל־כללי הבית שלנו.
כתב ויתור
המידע והפרסומים אינם מיועדים להיות, ואינם מהווים, ייעוץ או המלצה פיננסית, השקעתית, מסחרית או מכל סוג אחר המסופקת או מאושרת על ידי TradingView. קרא עוד ב־תנאי השימוש.
סקריפט קוד פתוח
ברוח האמיתית של TradingView, יוצר הסקריפט הזה הפך אותו לקוד פתוח, כך שסוחרים יוכלו לעיין בו ולאמת את פעולתו. כל הכבוד למחבר! אמנם ניתן להשתמש בו בחינם, אך זכור כי פרסום חוזר של הקוד כפוף ל־כללי הבית שלנו.
כתב ויתור
המידע והפרסומים אינם מיועדים להיות, ואינם מהווים, ייעוץ או המלצה פיננסית, השקעתית, מסחרית או מכל סוג אחר המסופקת או מאושרת על ידי TradingView. קרא עוד ב־תנאי השימוש.