PROTECTED SOURCE SCRIPT
Omega Ratio Tracker -> PROFABIGHI_CAPITAL
🌟 Overview
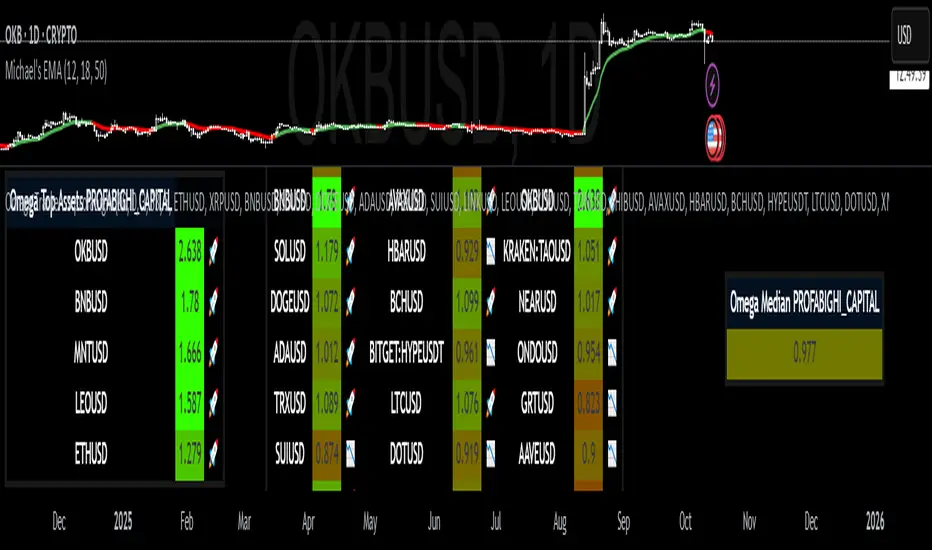
The Omega Ratio Tracker → PROFABIGHI_CAPITAL indicator quantifies the probability-weighted gain-to-loss efficiency by computing the Omega ratio for up to 33 customizable altcoins over a rolling lookback period, contrasting cumulative returns above a user-defined target against those below to assess favorable outcomes. It dynamically constructs color-gradient tables featuring individual Omegas, median benchmarks, and ranked top performers with emoji indicators, allowing traders to evaluate assets' upside potential relative to downside risks for informed, asymmetric opportunity selection.
⚙️ General Settings
– Calculation Period (Bars): Establishes the historical scope for return accumulation and threshold comparisons, where shorter windows spotlight immediate efficiencies amid market swings while extended periods gauge long-term gain/loss asymmetries—pivotal for matching trading cadences like intraday (e.g., 20-50 bars) or swing (e.g., 100+ bars).
– Target Return per Period (%): Specifies the aspirational return threshold per bar/day, serving as the pivot separating "gains" from "losses" in the ratio—elevated targets demand superior performance for positive Omegas, ideal for high-conviction filters, while modest ones broaden inclusion for diverse scans.
– Smoothing Period (EMA): Implements exponential moving average on raw ratios to mitigate transients, with low values (e.g., 1-2) retaining volatility for granular views and higher settings (e.g., 4-7) fostering trend persistence for strategic planning.
💎 Asset Selection Settings
– Number of Altcoins to Display: Dictates the primary table's expanse from a targeted 5-asset spotlight for swift evaluations to a maximal 33-symbol expanse for holistic risk-reward profiling—impacts processing demands and dashboard density.
– Number of Top Omega Assets: Tailors the elite leaderboard to showcase premier ratios, variable from 1 for ultra-focused highlights to the aggregate count for unfiltered excellence—expedites prioritization of high-gain/low-loss candidates.
– Asset 1-17 (Left Group): Loads the main table's left column with bedrock altcoins, facilitating bespoke curation from stalwarts like ETHUSD to varied mid-tiers such as XRPUSD—each solicits daily closes for autonomous Omega computation, with tooltips validating symbol protocols.
– Asset 18-33 (Right Group): Charges the right column for augmented diversification, embracing further tokens from LTCUSD to esoteric picks like MNTUSD—cultivates equilibrated tri-column ergonomics for lateral dataset traversal.
– Dynamic Input Activation: Manifests fields per asset tally, obfuscating redundants to forestall faults and declutter—empowers fluid augmentation from succinct rosters to panoramic oversight sans reconfiguration.
🎨 Table Style Settings
– Low Omega Color: Grounds the gradient's unfavorable terminus (e.g., stark red for ratios below 1.0), instantaneously tagging assets with skewed losses over gains that might erode portfolio viability.
– High Omega Color: Secures the advantageous apex (e.g., radiant green for ratios above 1.0), illuminating prospects with dominant upsides relative to downsides for asymmetric edge hunting.
– Neutral Omega Value: Locates the color fulcrum at equilibrium efficiency (typically 1.0 for balanced outcomes), where ratios modulate from penalty to premium—refinement inclines toward prudent or venturesome outlooks.
– Omega Color Range: Regulates the transitional amplitude encircling neutral, favoring expansive fades for refined gradations or constricted shifts for unequivocal high/low bifurcation.
– Table Background: Imposes a discreet dark semi-opaque substrate for thematic cohesion and theme-agnostic legibility, evoking a refined analytics interface.
– Table Border: Encases perimeters with subdued gray for tacit delineation, encapsulating intelligence without stylistic encumbrance.
📡 Data Fetching
– Asset Data Retrieval: Undertakes simultaneous daily close interrogations for nominated symbols, interposing NA for lacunae to buttress table solidity.
– Return Series Computation: Extracts 1-period percentage variances from asset trajectories, proffering the elemental grist for gain/loss partitioning.
– Void Data Fortification: Implants sentinels (-9999) for lacunae, materializing as grays in renderings to signify incompleteness sans architectural compromise.
🧮 Calculations
– Periodic Return Generation: Forges bar/daily percentage alterations as source divided by antecedent minus unity, underpinning the discrete quanta for target-relative dissection.
– Target Threshold Decimalization: Transmutes percentage input to fractional form, delineating the demarcation betwixt accretive and detractive outcomes.
– Cumulative Gain Accrual: Aggregates excesses above target over the period, encapsulating favorable deviations' aggregate potency.
– Cumulative Loss Accrual: Tallies shortfalls below target, quantifying adverse deviations' collective burden.
– Raw Omega Formulation: Divides gains by losses, yielding the probability-adjusted efficiency quotient—defaults to NA on nil losses for interpretive clarity.
– EMA Transient Suppression: Exponentially averages raw quotients to quell ephemera, engendering interpretable contours over jagged dailies.
– Annualization Omission: Presents periodic ratios without scaling, prioritizing raw bar-level insights for intraday or short-term applicability.
📋 Table Display
– Dynamic Layout Optimization: Assembles columns (apex 9 for tri-set orchestration) and rows calibrated to asset quantum plus header, vouchsafing succinct potency for 1-33 symbols.
– Main Table Architecture: Branded header vaults the apical row, shadowed by asset symbols, rounded quotients (3 decimals), and efficiency emojis in parsimonious trios for row-thrifty perusal.
– Omega Color Continuum: Cartographs values from low (red) via neutral (midpoint) to high (green), with grays for voids—precipitates immediate gain/loss equilibrium profiling.
– Emoji Efficiency Markers: Dispatches rocket for above-median quotients (asymmetric victors) and downward arrow for below (lopsided laggards), infusing expeditious visual discernment.
– Median Table Encapsulation: Terse single-column depiction of pivotal quotient with gradient tint, mooring relative appraisals as a parity linchpin.
– Top Omega Table Hierarchy: Descending stratification in 3-column lattice (symbol, value, emoji) with header branding, converging on paramount assets for gain-dominant dispositions.
– Index-Fueled Ranking: Mobilizes array indices for descending distillation, refabricating sorted arrays while custodians originals for scrupulous median genesis.
🔔 Alerts
– Dynamic Alert Fabrication: Erects newline-segmented compendia of symbols and rounded quotients on the ultimate bar, amputating prefixes for laconic phrasing.
– Once-Per-Bar Dispatch: Ignites alerts at closure with the plenary dataset, harmonizing external adjuncts like dispatches or automata.
– Output Refinement: Distills parseable essence by eliding NAs, honing on operable datum for unencumbered conduit amalgamation.
✅ Key Takeaways
– Gain/loss partitioning via target thresholds unveils asymmetric efficiency beyond traditional metrics.
– Rolling computations with smoothing furnish trend-stable, noise-attenuated efficiency vistas.
– Profuse symbol pliancy forges bespoke crypto observatories from titans to obscurities.
– Gradient lattices with medians and tops hasten low-loss/high-gain discernment through optics.
– Automated alerts encapsulate scans into consumable missives, hastening from scrutiny to stratagem.
סקריפט מוגן
סקריפט זה פורסם כמקור סגור. עם זאת, אתה יכול להשתמש בו באופן חופשי וללא כל הגבלה - למד עוד כאן.
כתב ויתור
המידע והפרסומים אינם אמורים להיות, ואינם מהווים, עצות פיננסיות, השקעות, מסחר או סוגים אחרים של עצות או המלצות שסופקו או מאושרים על ידי TradingView. קרא עוד בתנאים וההגבלות.
סקריפט מוגן
סקריפט זה פורסם כמקור סגור. עם זאת, אתה יכול להשתמש בו באופן חופשי וללא כל הגבלה - למד עוד כאן.
כתב ויתור
המידע והפרסומים אינם אמורים להיות, ואינם מהווים, עצות פיננסיות, השקעות, מסחר או סוגים אחרים של עצות או המלצות שסופקו או מאושרים על ידי TradingView. קרא עוד בתנאים וההגבלות.