PROTECTED SOURCE SCRIPT
Bollinger Bands + VWMA Signal
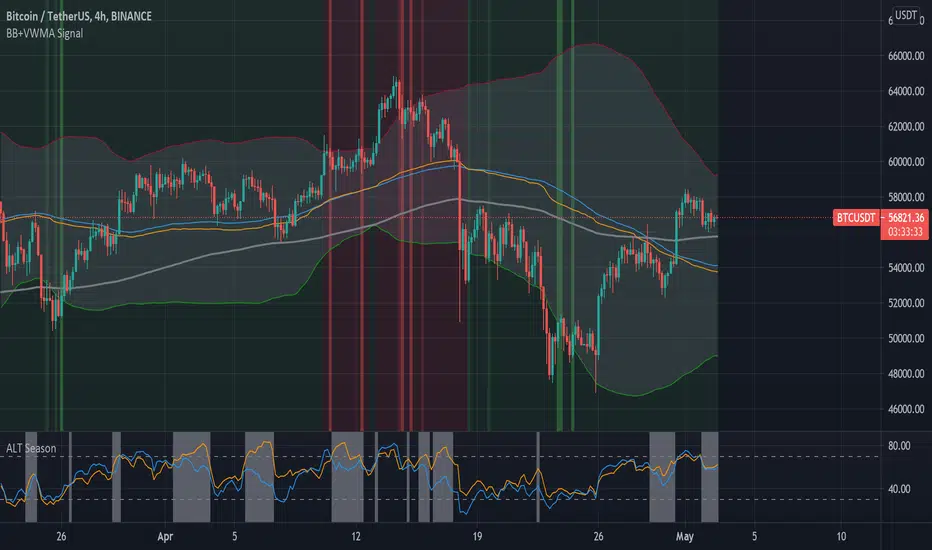
In this tool we can use Bollinger bands together with VWMA (volume weighted moving average) and Buy/Sell signals.
Red lines shows sell opportunities and green lines shows buy opportunities.
Sell and buy opportunities are deducted based on two moving average: (base MA) and VWMA.
This tool works in any time frames, but 4H is recommend.
The base moving average is set to 89 (in 4H) and you can change it to any values like (13, 21, 34, 55, 89, 144, ...).
The long(200) moving average can be used as a trend indicator, as well as support and resistance.
You may leave a like of you find it useful.
סקריפט מוגן
סקריפט זה פורסם כמקור סגור. עם זאת, תוכל להשתמש בו בחופשיות וללא כל מגבלות – למד עוד כאן
כתב ויתור
המידע והפרסומים אינם מיועדים להיות, ואינם מהווים, ייעוץ או המלצה פיננסית, השקעתית, מסחרית או מכל סוג אחר המסופקת או מאושרת על ידי TradingView. קרא עוד ב־תנאי השימוש.
סקריפט מוגן
סקריפט זה פורסם כמקור סגור. עם זאת, תוכל להשתמש בו בחופשיות וללא כל מגבלות – למד עוד כאן
כתב ויתור
המידע והפרסומים אינם מיועדים להיות, ואינם מהווים, ייעוץ או המלצה פיננסית, השקעתית, מסחרית או מכל סוג אחר המסופקת או מאושרת על ידי TradingView. קרא עוד ב־תנאי השימוש.