OPEN-SOURCE SCRIPT
AUTO STOP LEVEL
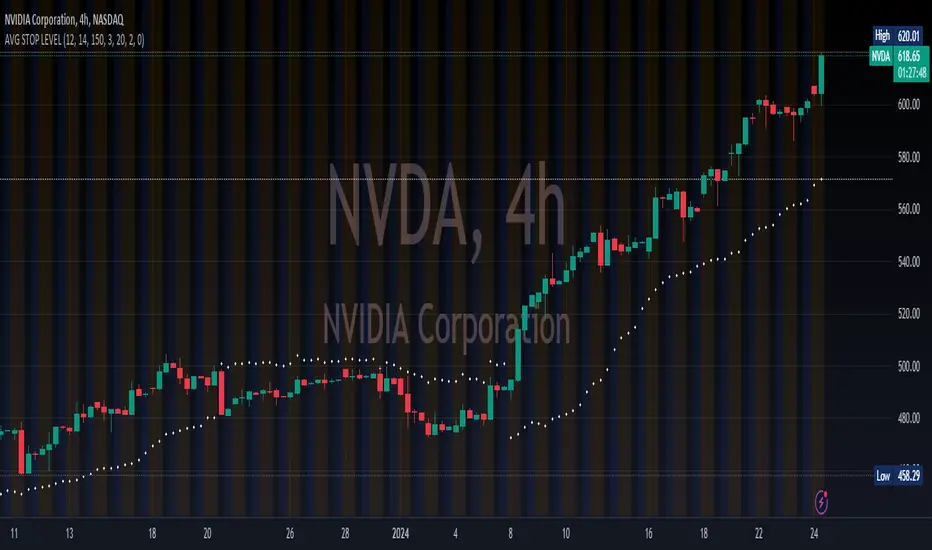
This is a simple yet highly efficient code that calculates stop levels, taking into account the market trend and its volatility.
This script calculates and displays (as a white point in the chart) a stop-loss by considering both volatility and the nearest support/resistance point.
The stop level is determined as the average of three specific values: firstly, two distinct volatility indicators - ATR and Bollinger Bands, and finally, the nearest support/resistance provided by the Supertrend indicator.
Moreover, it analyzes the trend to determine whether the stop should be set for long or short positions, providing insights into the most probable path of future prices. For instance, if the calculated stop level is below the current market prices, it suggests taking long positions, and vice versa.
Customization options include fine-tuning the standard parameters for the three indicators used in averaging and selecting multiple time frames.
סקריפט קוד פתוח
ברוח האמיתית של TradingView, יוצר הסקריפט הזה הפך אותו לקוד פתוח, כך שסוחרים יוכלו לעיין בו ולאמת את פעולתו. כל הכבוד למחבר! אמנם ניתן להשתמש בו בחינם, אך זכור כי פרסום חוזר של הקוד כפוף ל־כללי הבית שלנו.
כתב ויתור
המידע והפרסומים אינם מיועדים להיות, ואינם מהווים, ייעוץ או המלצה פיננסית, השקעתית, מסחרית או מכל סוג אחר המסופקת או מאושרת על ידי TradingView. קרא עוד ב־תנאי השימוש.