OPEN-SOURCE SCRIPT
ROC Tide
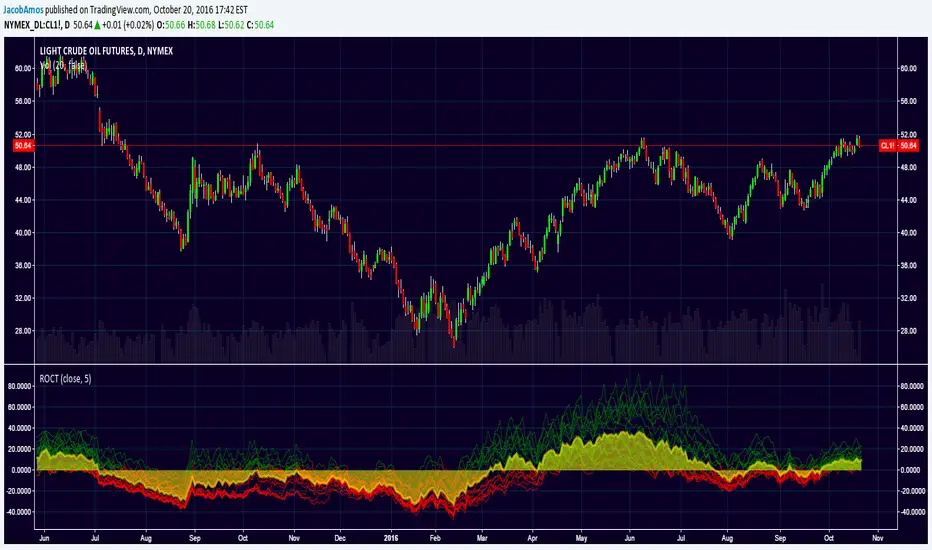
Adds some depth to the traditional rate of change (ROC) indicator. Instead of just having one ROC line with a single lookback period, this takes a minimum lookback period, n, and plots 20 ROC lines with lookback periods of n, 2n, 3n, ..., 20n. These lines will appear green when greater than zero, red when less than zero, and yellow when equal to zero by default.
Then it plots the average of those 20 ROC's as a yellow filled area so as to make it easier to see where the balance (or "tide") of the ROC waves are located.
Then it plots the average of those 20 ROC's as a yellow filled area so as to make it easier to see where the balance (or "tide") of the ROC waves are located.
סקריפט קוד פתוח
ברוח האמיתית של TradingView, יוצר הסקריפט הזה הפך אותו לקוד פתוח, כך שסוחרים יוכלו לעיין בו ולאמת את פעולתו. כל הכבוד למחבר! אמנם ניתן להשתמש בו בחינם, אך זכור כי פרסום חוזר של הקוד כפוף ל־כללי הבית שלנו.
כתב ויתור
המידע והפרסומים אינם מיועדים להיות, ואינם מהווים, ייעוץ או המלצה פיננסית, השקעתית, מסחרית או מכל סוג אחר המסופקת או מאושרת על ידי TradingView. קרא עוד ב־תנאי השימוש.