PROTECTED SOURCE SCRIPT
מעודכן MTF RSI Bounce+ [Intromoto]
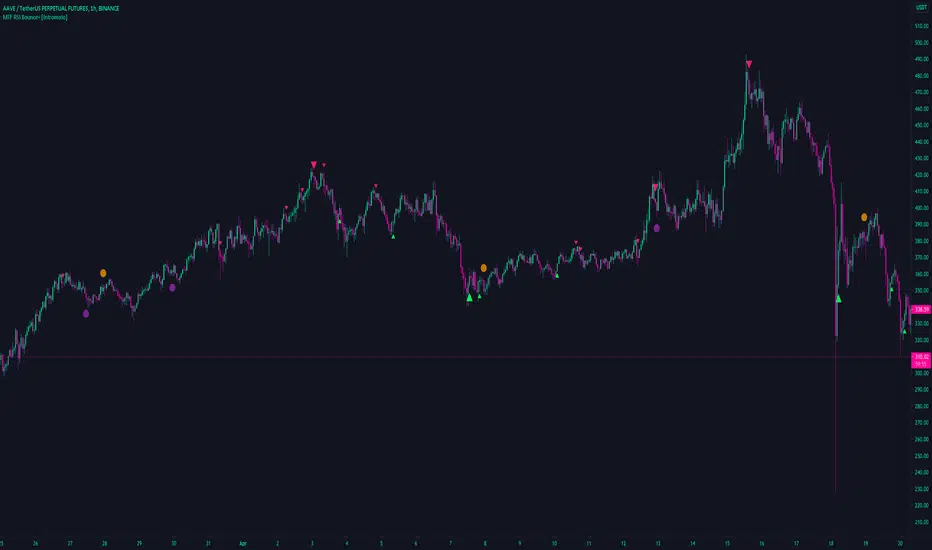
This script focuses on the relative strength index of an asset and plots shapes/lines based of "bounce" and crosses of the 50 midline
Barcoloring is based on the lower time frame over/under 50 for directional bias.
Smaller plotshapes are printed when the rsi "bounces" on the lower time frame 50, i.e is higher at first, lower on second, and back above the 50 on the 3rd close of the sequence.
Larger plotshapes occur on higher time frame, "D" by default, RSI crossovers. A line, user input styling available, is plotted horizontally for reference.
Alerts added for the HTF crossover/under
Thanks
הערות שחרור
Clarified inputs, removed HTF bounce. Styles changedהערות שחרור
Changed default HTF resolution to 12Hהערות שחרור
Style settings and metrics changes. Added two more bounce sets, which abide by the same period length and chart resolution. Removed HTF bounce resolution. סקריפט מוגן
סקריפט זה פורסם כמקור סגור. עם זאת, תוכל להשתמש בו בחופשיות וללא כל מגבלות – למד עוד כאן
DM for access.
Follow on Twitter for updates.
One time fee, no subscription
twitter.com/IntroMoto
Follow on Twitter for updates.
One time fee, no subscription
twitter.com/IntroMoto
כתב ויתור
המידע והפרסומים אינם מיועדים להיות, ואינם מהווים, ייעוץ או המלצה פיננסית, השקעתית, מסחרית או מכל סוג אחר המסופקת או מאושרת על ידי TradingView. קרא עוד ב־תנאי השימוש.
סקריפט מוגן
סקריפט זה פורסם כמקור סגור. עם זאת, תוכל להשתמש בו בחופשיות וללא כל מגבלות – למד עוד כאן
DM for access.
Follow on Twitter for updates.
One time fee, no subscription
twitter.com/IntroMoto
Follow on Twitter for updates.
One time fee, no subscription
twitter.com/IntroMoto
כתב ויתור
המידע והפרסומים אינם מיועדים להיות, ואינם מהווים, ייעוץ או המלצה פיננסית, השקעתית, מסחרית או מכל סוג אחר המסופקת או מאושרת על ידי TradingView. קרא עוד ב־תנאי השימוש.