OPEN-SOURCE SCRIPT
מעודכן Historic High Lows Adaptive
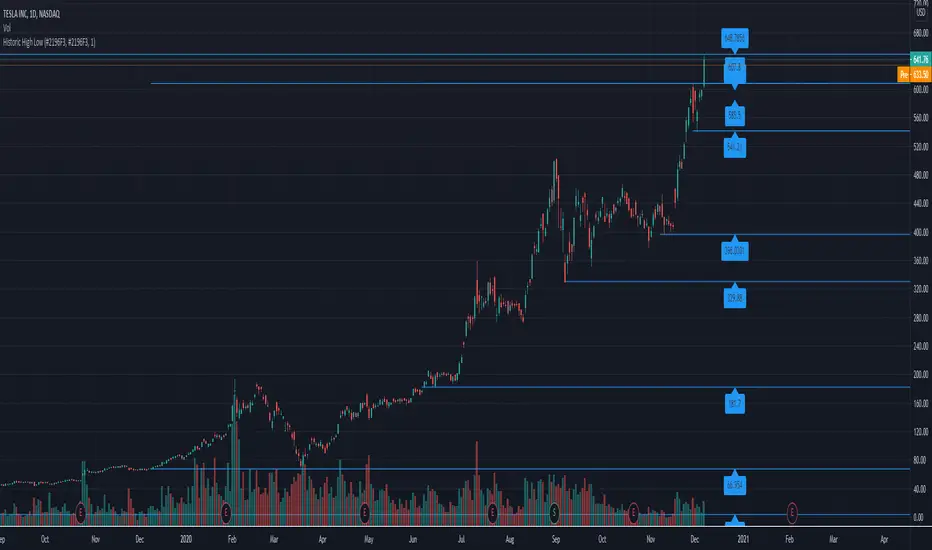
This will plot in the ticker opened:
-All-time High and Low
-1 Year High and Low
-6 Months High and Low
-3 Months High and Low
-1 Month High and Low
-1 Week High and Low
-Previous day High and Low
Colors, extending the line to the right, width, showing price tag are all parameters.
High and Low calculations are updated daily
Lines haves issues sometimes rendering when the candles are in a period too small.
הערות שחרור
Updated Script to fix issue where lines would be redrawn if a high or low are made on intraday. It should now only look at the past dates and prevent the line from redrawing till the next day.סקריפט קוד פתוח
ברוח האמיתית של TradingView, יוצר הסקריפט הזה הפך אותו לקוד פתוח, כך שסוחרים יוכלו לעיין בו ולאמת את פעולתו. כל הכבוד למחבר! אמנם ניתן להשתמש בו בחינם, אך זכור כי פרסום חוזר של הקוד כפוף ל־כללי הבית שלנו.
כתב ויתור
המידע והפרסומים אינם מיועדים להיות, ואינם מהווים, ייעוץ או המלצה פיננסית, השקעתית, מסחרית או מכל סוג אחר המסופקת או מאושרת על ידי TradingView. קרא עוד ב־תנאי השימוש.
סקריפט קוד פתוח
ברוח האמיתית של TradingView, יוצר הסקריפט הזה הפך אותו לקוד פתוח, כך שסוחרים יוכלו לעיין בו ולאמת את פעולתו. כל הכבוד למחבר! אמנם ניתן להשתמש בו בחינם, אך זכור כי פרסום חוזר של הקוד כפוף ל־כללי הבית שלנו.
כתב ויתור
המידע והפרסומים אינם מיועדים להיות, ואינם מהווים, ייעוץ או המלצה פיננסית, השקעתית, מסחרית או מכל סוג אחר המסופקת או מאושרת על ידי TradingView. קרא עוד ב־תנאי השימוש.