OPEN-SOURCE SCRIPT
Bollinger Bands %B Compare Vix

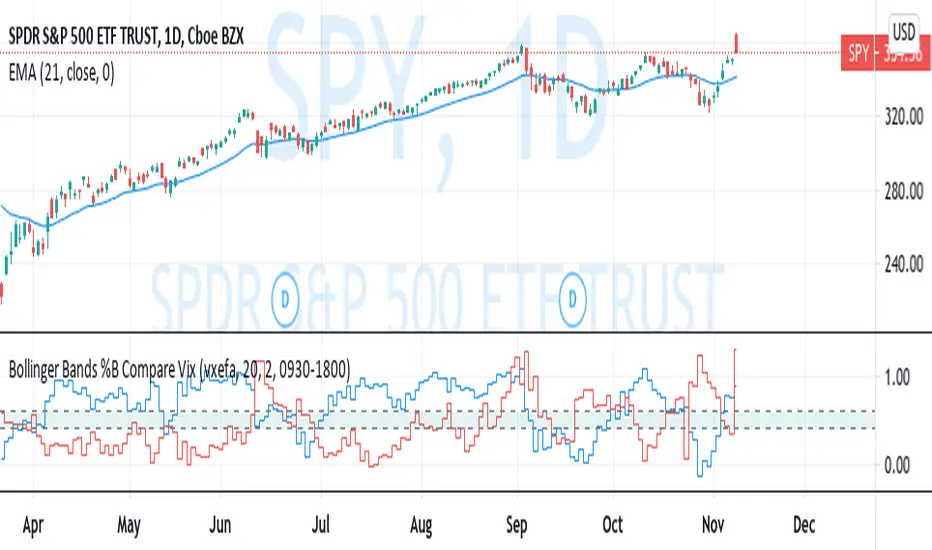
This imple script converts your chosen chart price and outputs it as a percentage in relation to the Vix percentage.
If price (Blue line) is higher than 0.60 and vix (Red Line) is lower than 0. 40 then there is lower volatility and this is good for buying.
If price (Blue line) is lower than 0. 40 and vix (Red Line) is higher than 0.60 then there is higher volatility and this is good for selling, exiting and cash only.
If you like risk you can enter as soon as the price and vix cross in either direction
This is my first script, please give me a lot of critique, I won't cry hahaha :)
For greater accuracy, you use these Vix products for their specific stocks/Indicies:
Apple - VVXAPL
Google - VVXGOG
Amazon - VVXAZN
IBM - VVXIBM
Goldman Sachs - VVXGS
NASDAQ 100 = VXN
VXN
SP100 - $CBOE:VXO
SP500 (3months) - VIX3M
VIX3M
XLE(energy sector) - $CBOE:VXXLE
EWZ(brazil etf) - VVXEWZ
EEM( emerging markets etf) -VVXEEM
EFA (MSCI ETF) - VVXEFA
FXI (Cina ETF) - VVXFXI
If price (Blue line) is higher than 0.60 and vix (Red Line) is lower than 0. 40 then there is lower volatility and this is good for buying.
If price (Blue line) is lower than 0. 40 and vix (Red Line) is higher than 0.60 then there is higher volatility and this is good for selling, exiting and cash only.
If you like risk you can enter as soon as the price and vix cross in either direction
This is my first script, please give me a lot of critique, I won't cry hahaha :)
For greater accuracy, you use these Vix products for their specific stocks/Indicies:
Apple - VVXAPL
Google - VVXGOG
Amazon - VVXAZN
IBM - VVXIBM
Goldman Sachs - VVXGS
NASDAQ 100 =
SP100 - $CBOE:VXO
SP500 (3months) -
XLE(energy sector) - $CBOE:VXXLE
EWZ(brazil etf) - VVXEWZ
EEM( emerging markets etf) -VVXEEM
EFA (MSCI ETF) - VVXEFA
FXI (Cina ETF) - VVXFXI
סקריפט קוד פתוח
ברוח האמיתית של TradingView, יוצר הסקריפט הזה הפך אותו לקוד פתוח, כך שסוחרים יוכלו לעיין בו ולאמת את פעולתו. כל הכבוד למחבר! אמנם ניתן להשתמש בו בחינם, אך זכור כי פרסום חוזר של הקוד כפוף ל־כללי הבית שלנו.
כתב ויתור
המידע והפרסומים אינם מיועדים להיות, ואינם מהווים, ייעוץ או המלצה פיננסית, השקעתית, מסחרית או מכל סוג אחר המסופקת או מאושרת על ידי TradingView. קרא עוד ב־תנאי השימוש.