OPEN-SOURCE SCRIPT
מעודכן Volatility & Big Market Moves

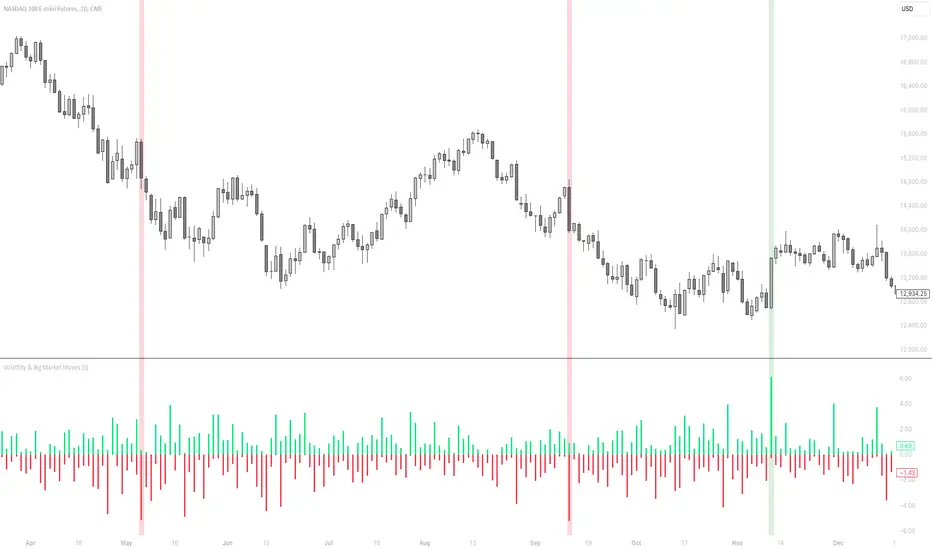
This indicator shows the volatility per candle, and highlights candles where volatility exceeds a defined threshold.
Data shown:
Furthest %-distance from the previous candle's closing price to the top (positive histogram).
Furthest %-distance from the previous candle's closing price to the bottom (negative histogram).
Data shown:
Furthest %-distance from the previous candle's closing price to the top (positive histogram).
Furthest %-distance from the previous candle's closing price to the bottom (negative histogram).
הערות שחרור
Slightly adjusted the calculation to calculate from the previous candle close instead of the current candle's high/low.הערות שחרור
"na" values in the histogram are now replaced with 0, so that the label on the scale shows the current candle's value at any time.סקריפט קוד פתוח
ברוח האמיתית של TradingView, יוצר הסקריפט הזה הפך אותו לקוד פתוח, כך שסוחרים יוכלו לעיין בו ולאמת את פעולתו. כל הכבוד למחבר! אמנם ניתן להשתמש בו בחינם, אך זכור כי פרסום חוזר של הקוד כפוף ל־כללי הבית שלנו.
כתב ויתור
המידע והפרסומים אינם מיועדים להיות, ואינם מהווים, ייעוץ או המלצה פיננסית, השקעתית, מסחרית או מכל סוג אחר המסופקת או מאושרת על ידי TradingView. קרא עוד ב־תנאי השימוש.
סקריפט קוד פתוח
ברוח האמיתית של TradingView, יוצר הסקריפט הזה הפך אותו לקוד פתוח, כך שסוחרים יוכלו לעיין בו ולאמת את פעולתו. כל הכבוד למחבר! אמנם ניתן להשתמש בו בחינם, אך זכור כי פרסום חוזר של הקוד כפוף ל־כללי הבית שלנו.
כתב ויתור
המידע והפרסומים אינם מיועדים להיות, ואינם מהווים, ייעוץ או המלצה פיננסית, השקעתית, מסחרית או מכל סוג אחר המסופקת או מאושרת על ידי TradingView. קרא עוד ב־תנאי השימוש.