PROTECTED SOURCE SCRIPT
MACD Cross-over Zones
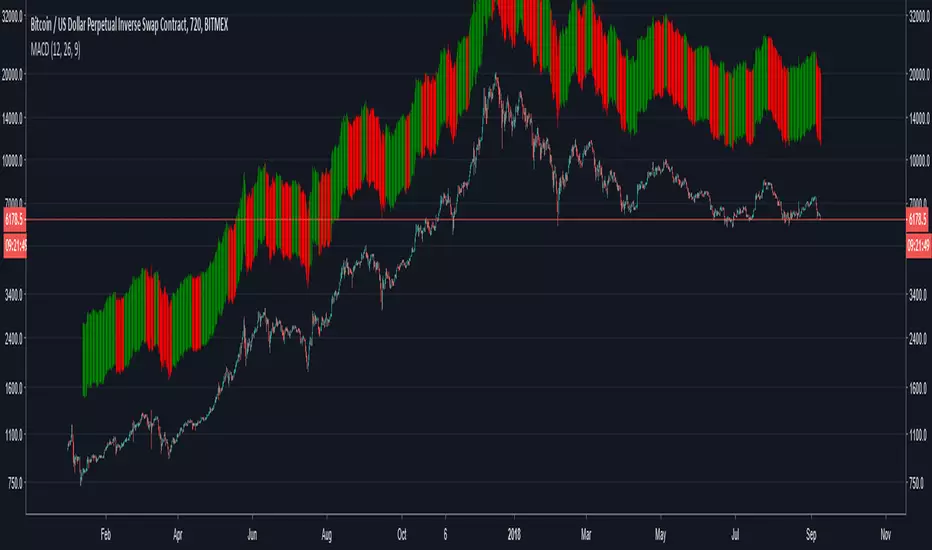
Bars above candles are color-based on MACD, when it turns bearish it will paint red and when it turns bullish green. Since the bars are painted above the candlestick one can see the price divergence in here too.
When one sees price is making higher highs or inside flat neutral momentum while MACD is in red, means weakness of selling.
When one sees price is making lower highs and MACD is red, it's signal that bears show strength and holding a short has more confidence until MACD turns green.
When one sees price is making lower highs and MACD is green, it's sign of weakness in buying, be cautious for reversal while holding (a long).
When one sees price is making higher highs and MACD is green, it's a sign of strength, one will be more confident holding a long until MACD turns red.
סקריפט מוגן
סקריפט זה פורסם כמקור סגור. עם זאת, תוכל להשתמש בו בחופשיות וללא כל מגבלות – למד עוד כאן
כתב ויתור
המידע והפרסומים אינם מיועדים להיות, ואינם מהווים, ייעוץ או המלצה פיננסית, השקעתית, מסחרית או מכל סוג אחר המסופקת או מאושרת על ידי TradingView. קרא עוד ב־תנאי השימוש.
סקריפט מוגן
סקריפט זה פורסם כמקור סגור. עם זאת, תוכל להשתמש בו בחופשיות וללא כל מגבלות – למד עוד כאן
כתב ויתור
המידע והפרסומים אינם מיועדים להיות, ואינם מהווים, ייעוץ או המלצה פיננסית, השקעתית, מסחרית או מכל סוג אחר המסופקת או מאושרת על ידי TradingView. קרא עוד ב־תנאי השימוש.